
Figure 9.
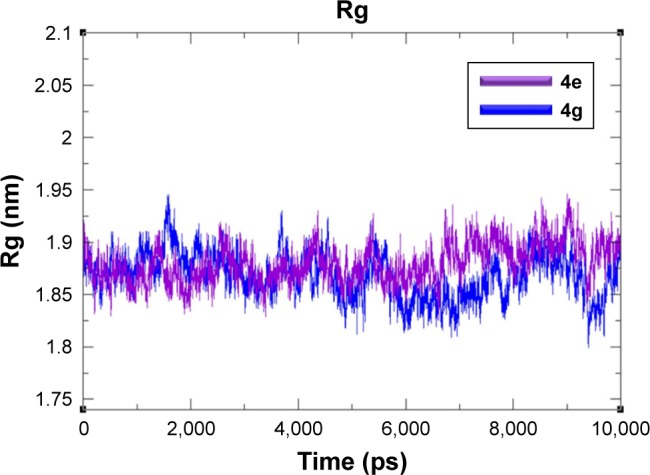
Rg graphs of 4e and 4g docked complexes are shown in purple and blue respectively from 0–10,000 ps time scale.
Abbreviation: Rg, radius of gyration.
Official websites use .gov
A
.gov website belongs to an official
government organization in the United States.
Secure .gov websites use HTTPS
A lock (
) or https:// means you've safely
connected to the .gov website. Share sensitive
information only on official, secure websites.
Rg graphs of 4e and 4g docked complexes are shown in purple and blue respectively from 0–10,000 ps time scale.
Abbreviation: Rg, radius of gyration.