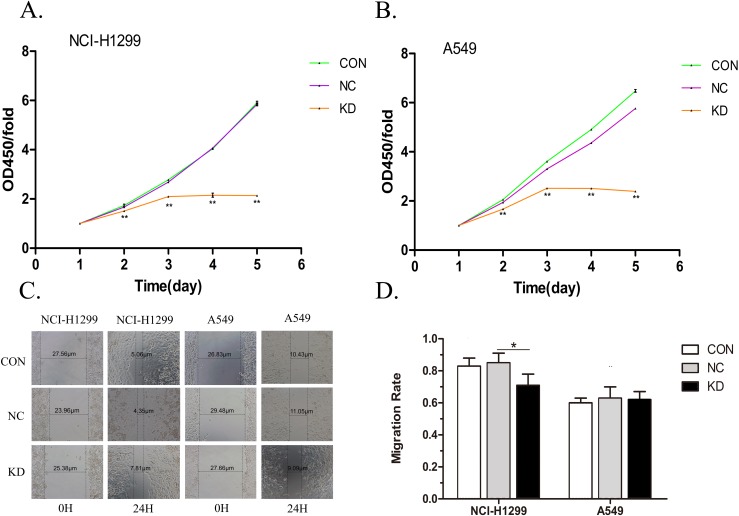
Figure 3. Detection of proliferation and migration ability of lung adenocarcinoma cells.
(A and B) Three differently colored lines were used to simulate changes in the cell viability over a period in different groups of lung adenocarcinoma cells. The proliferation of the KD group was significantly inhibited compared with the NC groups. Data are represented as mean (n = 5) and SD. (C) The distances marked in the figure represent the size of the scratches measured by inverted fluorescence microscopy at 0 and 24 h in the three different groups of NCI-H1299 and A549 cells. The images were captured at 40×. (D) This histogram represents the cell migration ability. PYCR1-Silencing had no effect on migration of NCI-H1299 and A549 cells in lung adenocarcinoma. Data are represented as mean (n = 3) and SD. (*P < 0.05; **P < 0.01).

