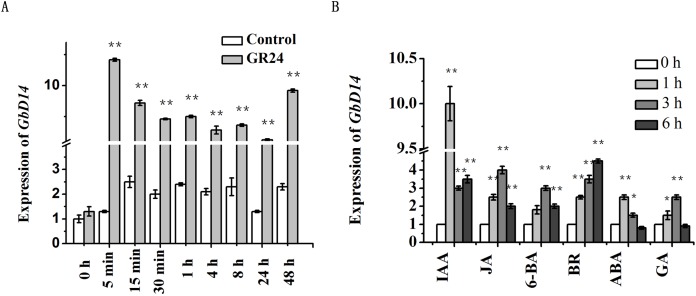
Figure 6. Analysis of the expression level of GbD14 in Hai1 with plant hormones treatment.
(A) The expression level of GbD14 was tested with or without GR24 treatment 0 h, 5 min, 15 min, 30 min, 1 h, 4 h, 8 h, 24 h, 48 h. GbUBQ7 was used as the internal control. (B) After hormones (IAA, JA, 6-BA, BR, ABA, GA) treatment 0, 1, 3, 6 h. Results are shown as mean ± SE of three replicates. Experiments were performed three times with consistent results. The single and double asterisks show significant differences between with GR24 (plant hormones) and without GR24 (plant hormones) by Student’s t-test at P ≤ 0.05 and P ≤ 0.01, respectively.

