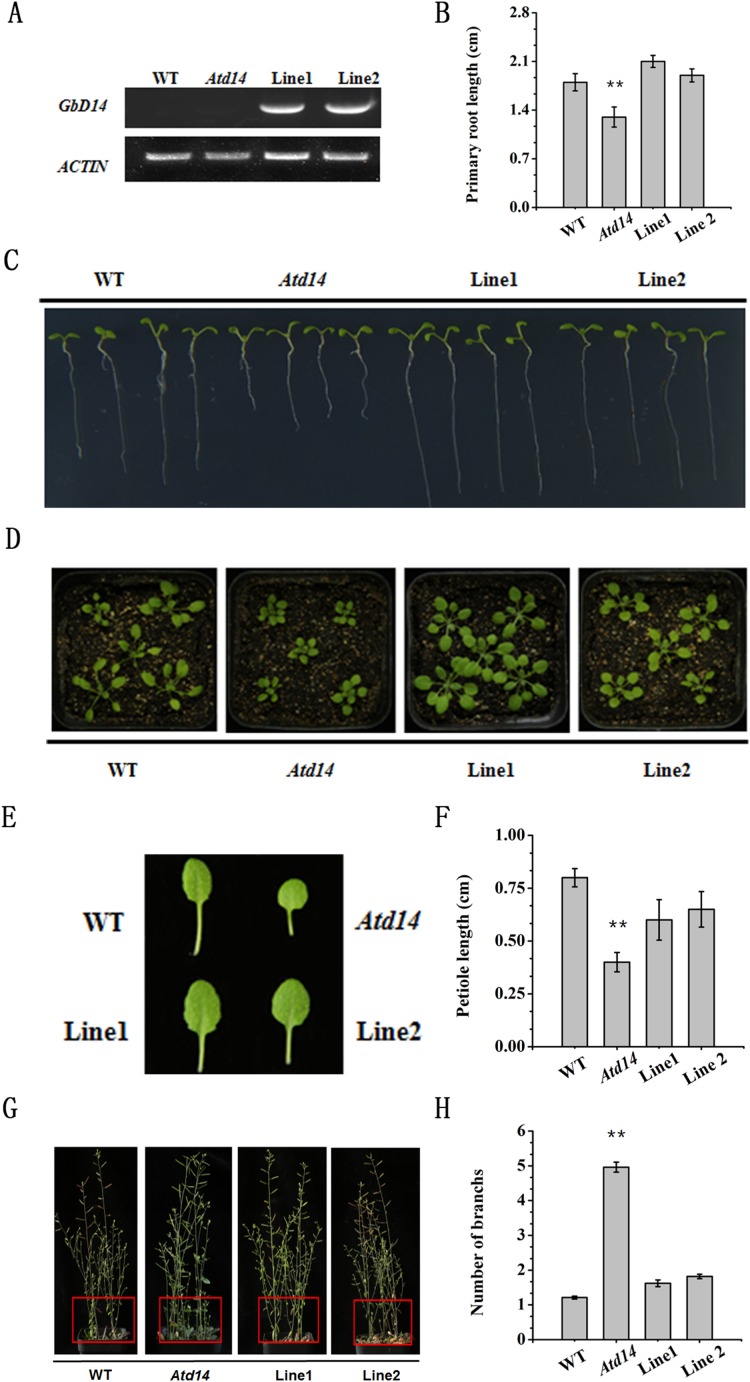
Figure 8. Phenotype of the recurrent line of Atd14 mutant.
(A) Analysis of the expression level of GbD14 in the complemented lines (Line1, Line2) by RT-PCR. ACTIN was used as the internal control. The expression level of GbD14 was detected in 7-day WT, Atd14 mutant, Line1, Line2 seedlings. (B and C) Root growth phenotype and statistics of the strains above. A total of 3-day-old seedlings grown on MS medium were transferred to MS medium. They continued to grow for 7 days before being photographed and measured. (D) Growth phenotype of seedlings in nutrient soil. A total of 7-day-old seedlings grown on MS medium were transferred to nutrient soil. They continued to grow for 14 days before being photographed and measured. (E) Representative leaf phenotypes of seedlings in (D). (F) Quantitative analysis on the leaf length for the sixth leaves of the indicated plants. (G) Shoot branching phenotypes of Line1 and Line2 at the bolting stage. The branches of each seedling are marked with a red square. (H) Statistical analysis of branch numbers. Experiments were performed three times with consistent results. A total of 30 plants were used per replicate. Results are shown as mean ± SE of three replicates. The double asterisks show significant differences between the WT and the transgenic plants by Student’s t-test at P ≤ 0.01, respectively.

