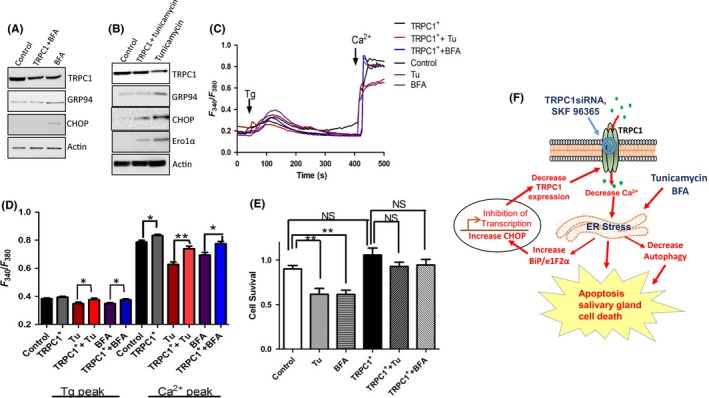
Figure 6.

Overexpression of TRPC1 rescues the effect of Tunicamycin (Tu) and Brefeldin A (BFA). (A,B), Respective western blots showing the expression of various endoplasmic reticulum (ER) stress markers in TRPC1 overexpressed cells pretreated with Tu and BFA. C, Representative trace showing Tg‐evoked Ca2+ entry and Ca2+‐evoked [Ca2+]i changes in various conditions as labeled in the figure. D, Bar diagram of the fluorescence ratio (340/380) from an average of 40‐60 cells. E, Bar diagram showing the cell survival of the cells pretreated with 10 μM Tu or BFA, respectively, for 24 h in TRPC1 overexpressed human salivary gland (HSG) cells. F, Schematic model showing the role of TRPC1 channels in ER stress and salivary gland cell death. Graphs are mean ± SEM, significance: *, P < 0.05; **, P < 0.001.
