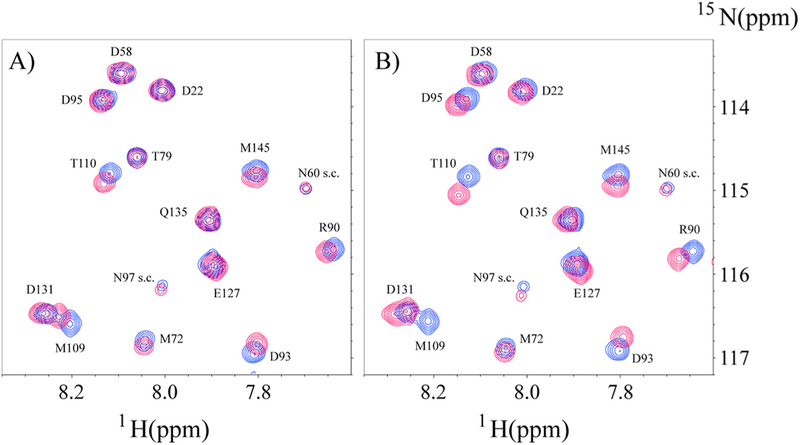
Fig. 6.

Overlay of selective spectra region of N-labeled Ca2+/CaM in the presence or absence of unlabeled SFWT (A) and LFWT (B) in solution. In both A) and B) the cross peaks in blue color are from free 15N-CaM, and the cross peaks in red color are from the mixture of Ca2+/CaM with SFWT in (A), and with LFWT in (B). The molar ratio between Ca2+/ CaM and peptide is 1:3. The s.c. label stands for side chain.
