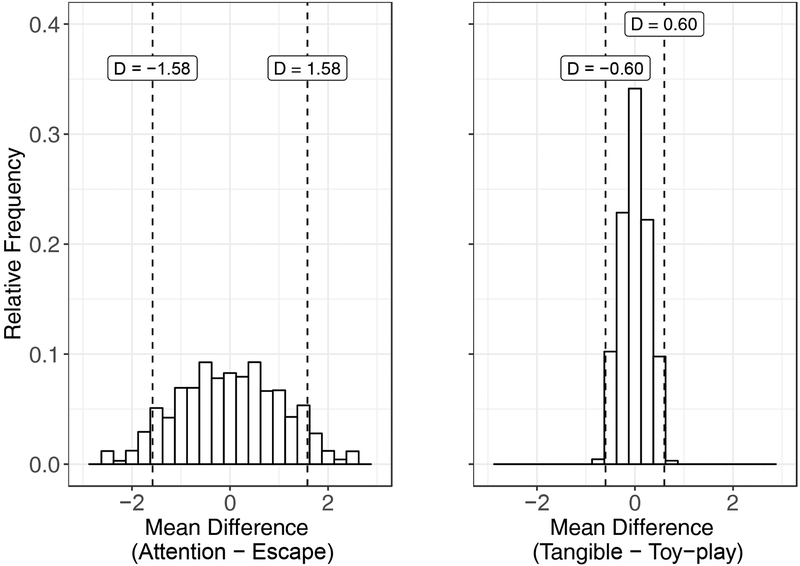
Fig. 6.
Reference distributions for mean differences comparing the attention and escape (left panel) and tangible to toy-play (right panel) conditions from the hypothetical functional analysis results shown in Fig. 5. The vertical dashed lines that bisect the x-axes in each panel represent the between-condition mean differences observed in the obtained data. The bin width for these histograms was D = 0.25.

