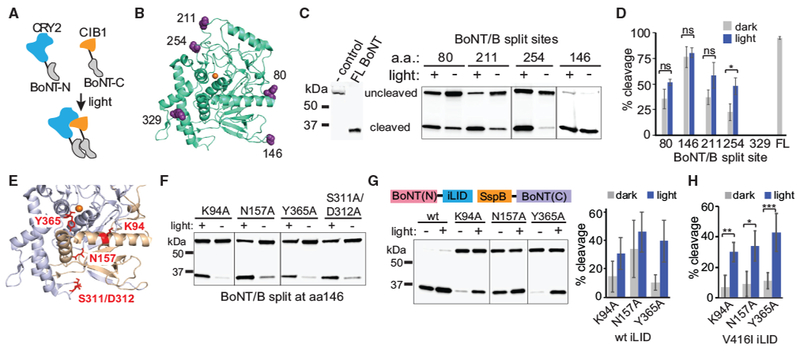
Figure 1. Split BoNT/B Can Be Reconstituted with Photodimerizers.

(A) Schematic illustrating reconstitution of split BoNT/B light chain N- and C-terminal fragments mediated by blue light-actuated interaction between CRY2 (blue) and CIBN (orange) photodimerizers.
(B) Location of split sites (purple) within BoNT/B light chain structure (PDB: 2ETF; green). The Zn2+ cofactor is shown in orange.
(C and D) Quantification of light-induced reconstitution of protease activity. HEK293T cells were transfected with a GFP-VAMP-GST cleavage reporter and BoNT/B N- and C-terminal fragments split at the indicated sites. Cells were treated with 461-nm blue light (2-s pulse every 3 min, 15.6 μW/cm2) or kept in dark for 4–5 hr and then analyzed by immunoblot for reporter cleavage. Representative immunoblot results are shown in (C). The line between 211 and 254 samples indicates that the intervening lane was removed; sample 146 was on a separate blot. A summary of reporter cleavage results (average and SD of 3 independent experiments) is shown in (D). ns, not significant; *p < 0.05, 2-tailed Student’s t test.
(E) Amino acids targeted for mutagenesis. Residues predicted to disrupt interaction between the 1–146 (gold) and 147–441 (purple) BoNT/B fragments are indicated in red (the Zn2+ cofactor is indicated in orange).
(F) Immunoblot showing BoNT/B (146-147) interface-disrupting mutations with low dark background and significant light-regulated activity when reconstituted with CRY2/CIB1 photodimerizers. Cells were treated as in (C). The line between N157A/Y365A indicates that the intervening lane was removed; K94A samples were on a separate blot.
(G) Quantification of BoNT/B 146-147 split fragments for reconstitution with iLID-SspBmilli. HEK293T cells were transfected with GFP-VAMP-GST and the indicated BoNT/B constructs and then treated as in (C). Light-treated samples were exposed to a 2-s pulse every 30 s for 4 h. Left: a representative blot; lines indicate that the intervening lanes were removed. Right: average percent cleavage and range of two independent experiments.
(H) Quantification of cleavage using BoNT/B 146-147, SspBmilli, and the long-lived V416I iLID variant. HEK293T cells were treated and analyzed as in (G) except for a 2-s light pulse every 3 min. Data show average and error (SD) from 3-6 independent experiments. *p < 0.05, **p < 0.005, ***p < 0.0005, 2-tailed Student’s t test.
