Figure 1.

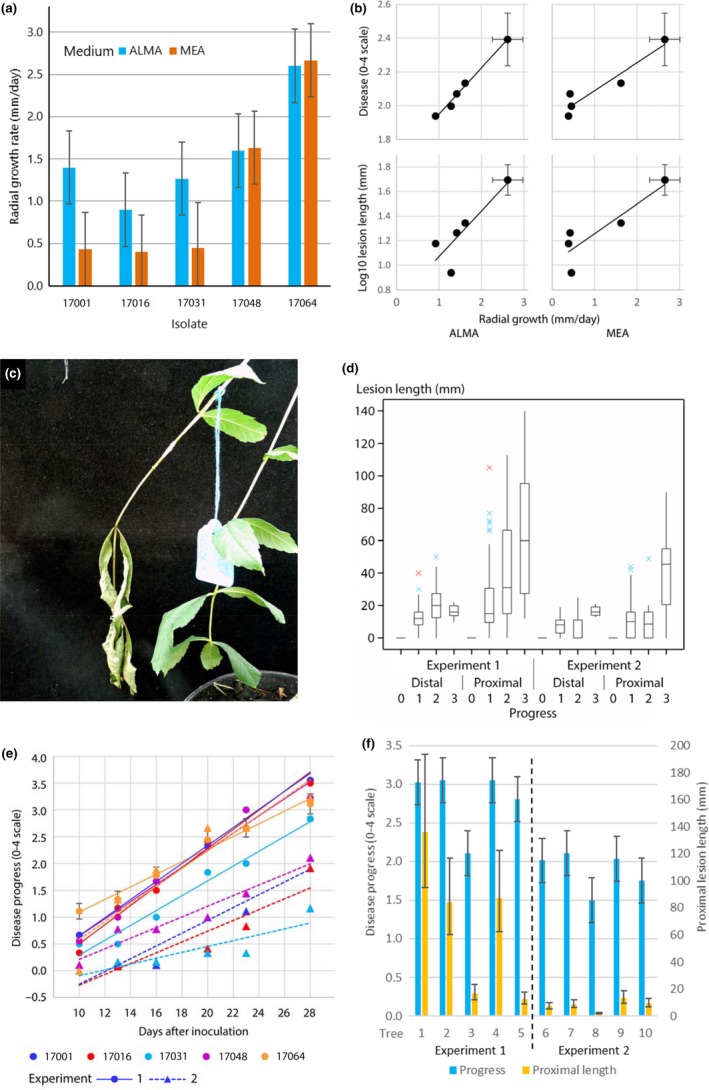
(a) Radial growth rate (mm per day) on ash leaf malt agar (ALMA) and malt extract agar of the five Hymenoscyphus fraxineus isolates used in inoculation experiments. Error bars are ±1 standard error (SE). (b) Relationship of disease progress (0–4 scale) and proximal lesion length (mm, log10 transformed) to in vitro growth rates of H. fraxineus. Each point represents one isolate. Representative error bars (±1 SE) are shown for isolate 17064. (c) An inoculated leaf at the top dead stage (progress score 3). The inoculation site, wrapped in Parafilm® M, is to the left of the tag. (d) Boxplot of distal and proximal lengths (mm) of lesions with Progress scores 0, 1, 2 or 3 at 28 days after inoculation in Experiments 1 and 2. Data are aggregated across isolates and trees. (e) Predicted mean disease progress (0–4 scale) of five H. fraxineus isolates in two experiments in each of which five trees were inoculated. (f) Predicted mean disease progress (0–4) and proximal length (mm) of lesions on ash seedling rachises infected with H. fraxineus at 28 days after inoculation. Trees 1–5 were tested in Experiment 1 and trees 6–10 in Experiment 2
