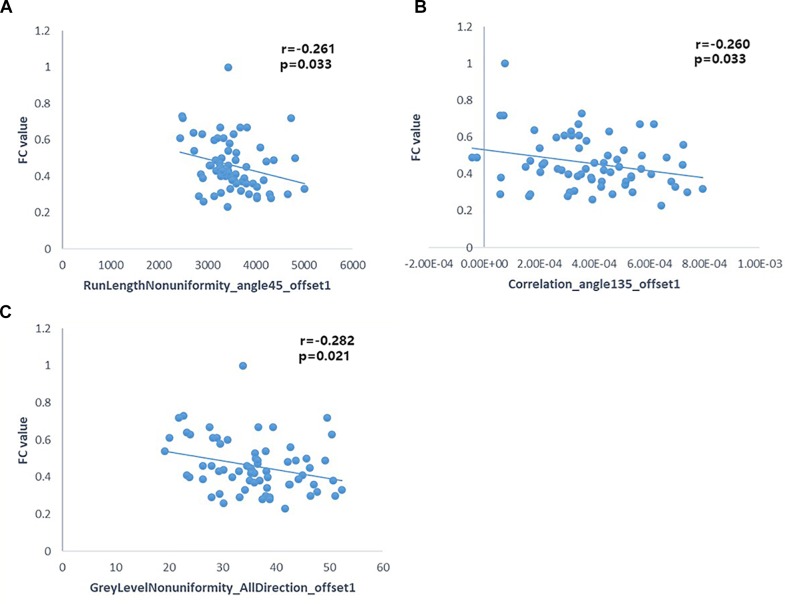
FIGURE 6.
Pearson correlation analysis between some radiomic features and FC of the left hippocampus (p < 0.05). Pearson’s correlation analysis between “RunLengthNonuniformity_angle45_offset1” and FC value (A); Pearson’s correlation analysis between “Correlation_angle135_offset1” and FC value (B); Pearson’s correlation analysis between “GreyLevelNonuniformity_AllDirection_offset1” and FC value (C).

