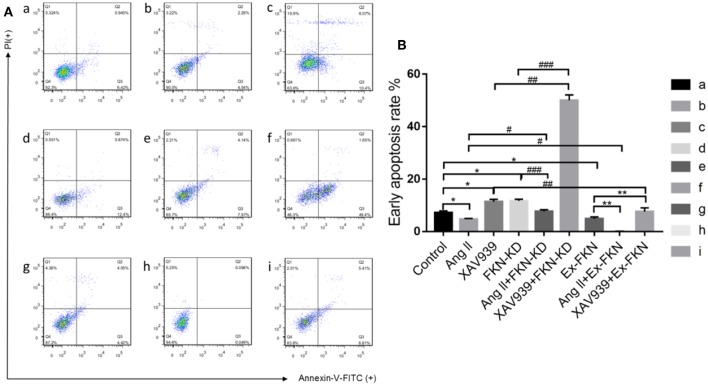
Figure 2.
Annexin V-FITC and PI staining to evaluate apoptosis in HK-2 cells following different treatment. The HK-2 cells were divided into nine groups and incubated for 48 h with annexin V-FITC and PI and analyzed using flow cytometry. (A) Q4: In each panel the lower left quadrant shows cells that are negative for both PI and annexin V-FITC. Q3: Upper right quadrant shows annexin positive cells (early apoptotic). Q2: Upper left quadrant shows only PI positive cells, which are necrotic. Q1: Lower right quadrant shows annexin and PI positive cells (late apoptotic cells). (a) control group; (b) Ang II group; (c) XAV939 group; (d) FKN-KD group; (e) Ang II + FKN-KD group; (f) XAV939 + FKN-KD group; (g) Ex-FKN group; (h) Ang II + Ex-FKN group; (i) XAV939 + Ex-FKN group.(B) The rate of early apoptotic cells (Q3) is represented in a histogram. p value represents *p < 0.05 compared with the control group;# p < 0.05 compared with Ang II group; ## p < 0.05 compared with XAV939 group; ### p < 0.05 compared with FKN-KD group; ** p < 0.05 compared with Ex-FKN group. Data are expressed as the means ± standard deviation (n = 3). Statistical analyses were performed using multi-way classification ANOVA.

