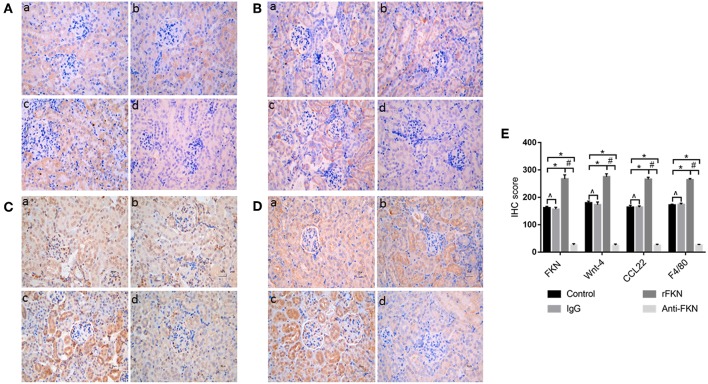
Figure 5.
Twelve-week-old MRL/lpr mice were IP injected with isotype antibody, recombinant-FKN protein, and anti-FKN antibody for 7 days. In kidney sections of MRL/lpr mice stained by IHC (original magnification, ×400). (a) Control group; (b) IgG group; (c) rFKN group; (d) anti-FKN group. (A) Expression of FKN as examined by IHC staining in the renal tissues. (B) Expression of Wnt-4 as examined by IHC staining in the renal tissues. (C) Expression of CCL22 as examined by IHC staining in the renal tissues. (D) Expression of F4/80 as examined by IHC staining in the renal tissues. (E) The column diagram indicates the statistical of (A-D). *p < 0.05 compared with the control group. No significant differences between IgG compared to the control group are indicated as *p > 0.05. Significant differences among the rFKN group and anti-FKN groups are indicated as #p < 0.05. Data are expressed as the means ± standard deviation (n = 3). Statistical analyses were performed using one-way ANOVA.

