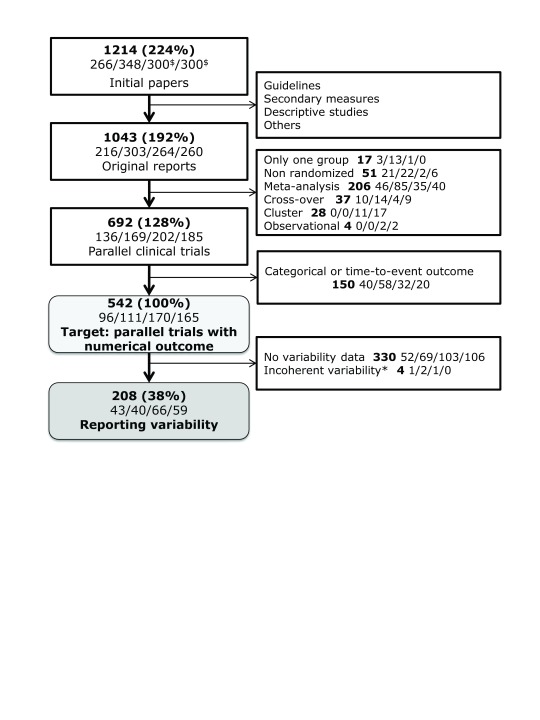
Figure 2. Flow-chart of the articles in the study.
Percentages represent the quantity of papers in the target population. The number of articles for each year (2004/2007/2010/2013) is specified in the second line of each box (separated by slashes). $300 papers were randomly selected for years 2010 and 2013. *Four papers were excluded because the variance of the change over time was inconsistent with both the baseline and final variances, which would lead to impossible absolute correlation estimates greater than 1.

