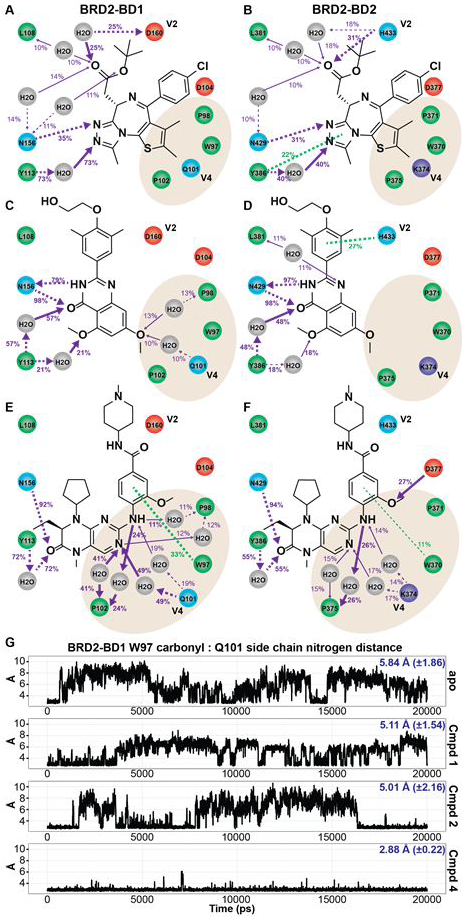
Figure 3. Interaction patterns of exemplar BETi bound to BRD2-BD1 and BRD2-BD2.

Ligand interaction analysis based on MD simulations of 1 (A,B), 2 (C,D), and 4 (E,F). Polar, hydrophobic, and charged residues are blue, green, and red circles, respectively. Purple and green arrows represent polar and pi-stacking interactions, respectively. Atoms receiving arrows are hydrogen bond acceptors. Solid and dotted lines indicate interactions with backbone and side chain, respectively. Percent values report the occupancy of the interaction, with 100% meaning the interaction was present in every snapshot of the MD simulation. Occupancies ≤10% and non-polar interactions are suppressed in the figures for clarity. For emphasis, arrow widths are larger for interactions with occupancy >20%. (G) Trajectory analysis of the distance between the backbone carbonyl of W97 and the Q101 side chain nitrogen in BRD2-BD1 MD simulations of the apo structure and exemplar BETi. Average distance and standard deviation reported in blue.
