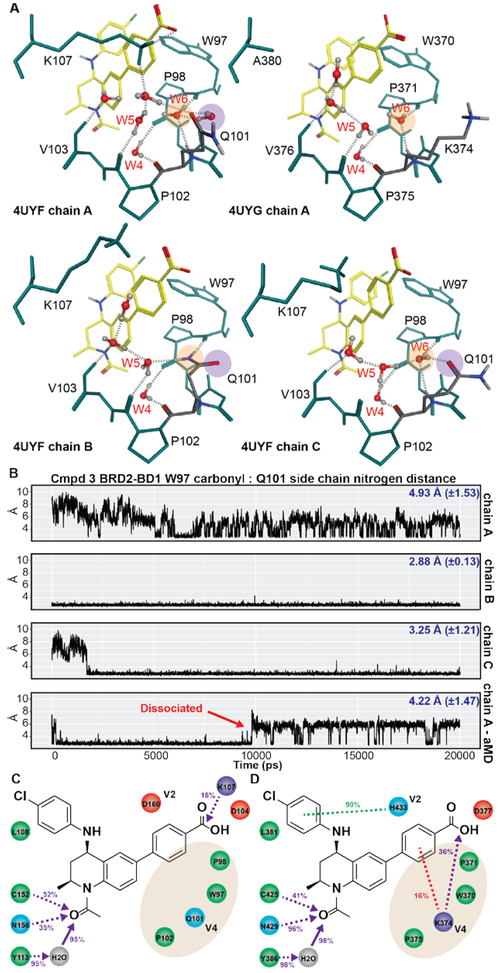
Figure 4. Analysis of water-mediated interactions in the ZA channel for 3 bound to BRD2-BD1 and BRD2-BD2.
(A) Representative water-mediated interactions from different chains in BRD2-BD1 (4UYF) and BRD2-BD2 (4UYG). Hydrogen bonds are depicted as dotted lines. (B) Trajectory analysis of the distance between the backbone carbonyl of W97 and the Q101 side chain nitrogen following MD simulations of chains A,B, and C from 4UYF. Average distance and standard deviation reported in blue. Ligand interaction analysis of 3 bound to (C) BRD2-BD1 and (D) BRD2-BD2. Legend is identical to that reported in Figure 3.

