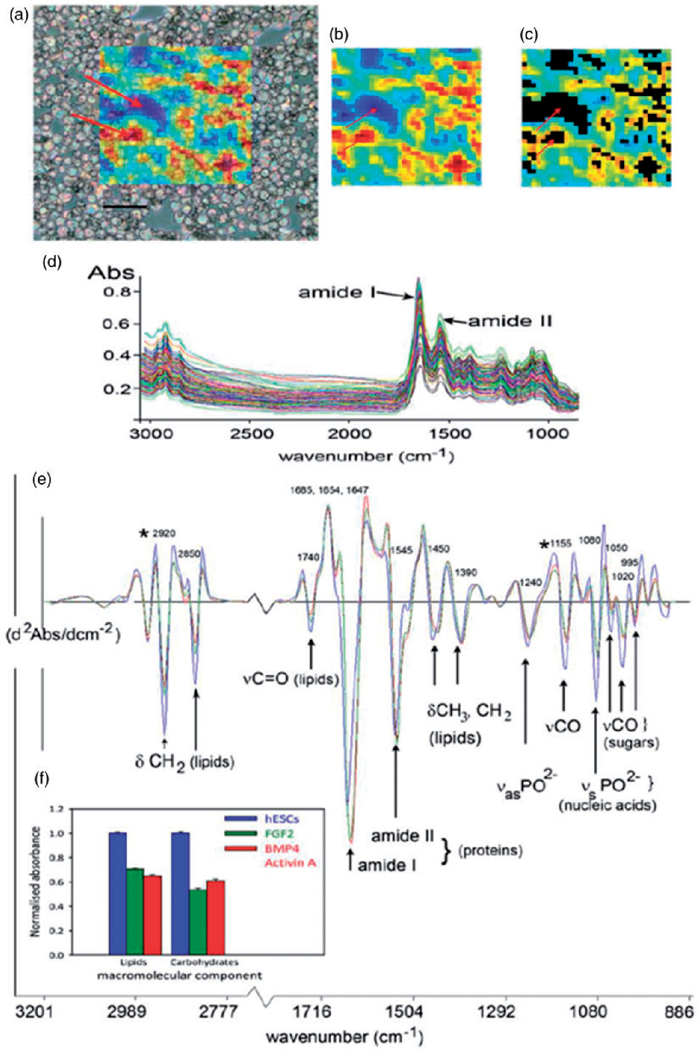
Figure 5.

Analysis of undifferentiated and differentiated human embryonic stem cells (hESCs) using IR imaging. (a) hESCs cytospun onto a MirrIR coated slide, overlayed with a colored grid showing the area of the slide imaged by the FPA. Each colored pixel represents the area of the slide (11 µm × 11 µm projection onto sample plane) where a single FT-IR spectrum was acquired. The color scale indicates the absorbance of the amide I protein band, used as an indication of total spectral absorbance by the sample. Arrows indicate areas of low absorbance (blue) where there were no cells, or where cells overlapped, and where absorbance is high (red). Scale bar, 100 µm. (b) The same FPA image grid as shown in (a) at full optical opacity. (c) Spectral quality testing rejects spectra that are too high or low in absorbance. Black areas indicate where spectra have been rejected from the dataset, including those areas indicated by the arrows in (a). (d) The spectral data set for hESCs in one experiment (n = 192), following quality testing, but prior to spectral pre-processing. The two prominent amide I and II protein bands at ~ 1650 and 1540 cm−1, respectively, are indicated. (e) Average spectra from the experiment in (d), for hESCs (n = 192), cells treated with cytokines BMP4/Act A for four days (n = 137), and those with the cytokine FGF for four days (n = 132). Prominent bands in the spectra have been assigned to functional group vibrations and corresponding macromolecular classes. (f) Histograms showing mean integrated areas for prominent lipid and glycogen bands (asterisked at 2920 and 1155 cm−1 in panel (e) in normalized second derivative spectra from the experiment in (d). The difference between the means of areas for both bands was significantly different between hESCs and differentiated progeny in this experiment (p < 0.001, by ANOVA). Error bars indicate standard errors of the means (hESC, n = 192; BMP4/Act A, n = 137; FGF2, n = 132).
