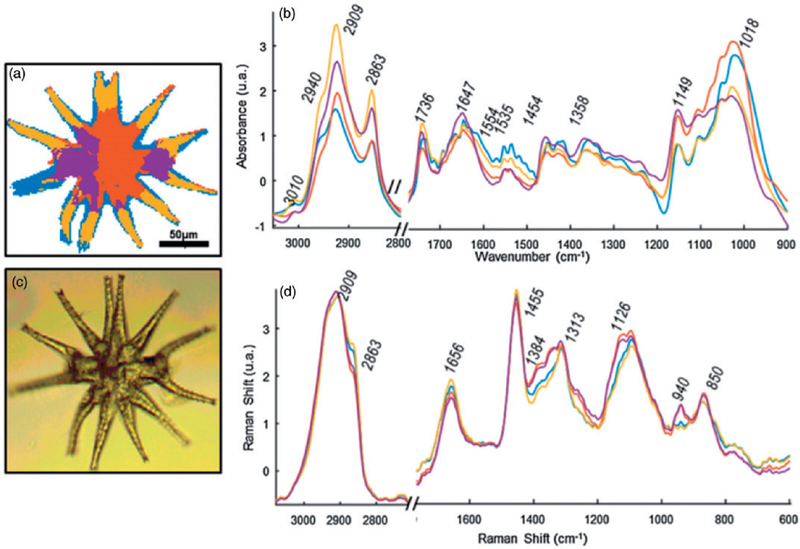
Figure 6.

UHCA of the multimodal image of a single Micrasterias algal cell. (a) Custer image. (b) Average infrared spectra of each class. (c) Visible image. (d) Raman average spectra of each class. Reproduced with permission from Perez-Guaita et al.93 Copyright 2017 Elsevier.
