
Figure 7.
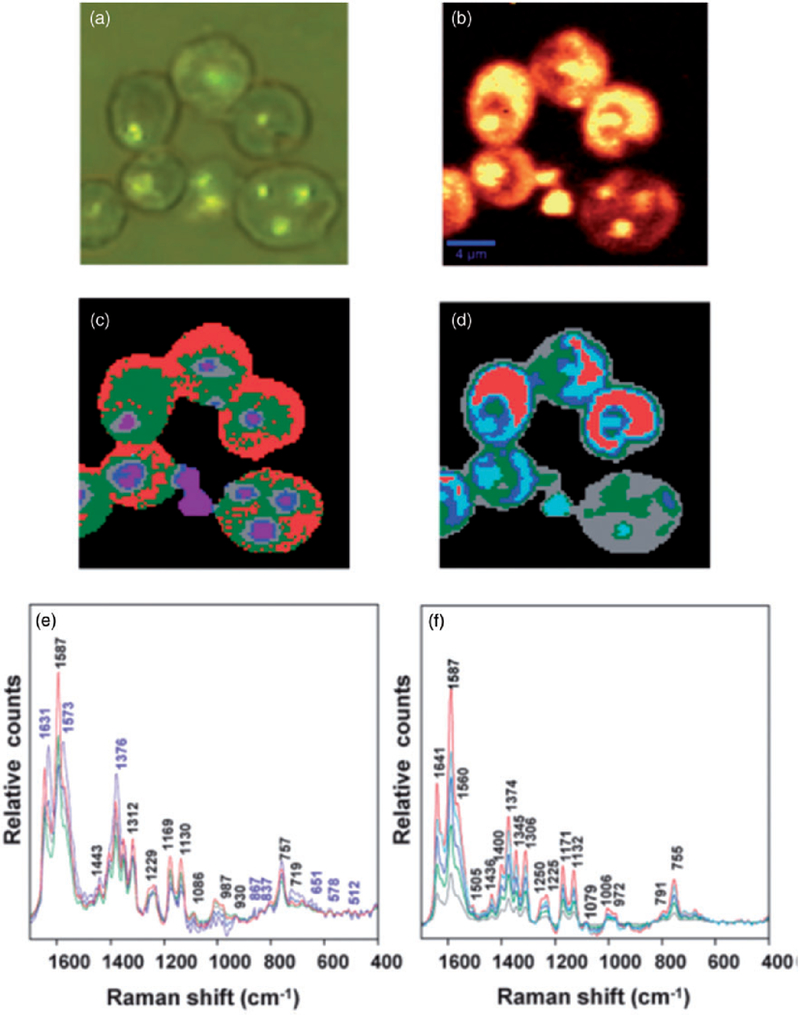
(a) Visible micrograph of infected RBCs demonstrating the partial darkfield effect, visualizing haemozoin deposits. (b) Chemical map generated by integrating the region between 1680 and 1620 cm−1. (c) Map of distribution of classes obtained using unsupervised hierarchical cluster analysis (UHCA), using the D-values distance algorithm for the 1700–1300 cm−1 range for five clusters. (c) UHCA map generated using the Euclidean distance algorithm for the 1700–1300 cm−1 range for five clusters. (e) Mean spectra corresponding to classes presented in (d). The purple labels correspond to bands mainly associated with haemozoin while the black labels are characteristic hemoglobin bands. (f) Mean spectra corresponding to classes presented in (e). The spectra show characteristic bands of hemoglobin, but not haemozoin.