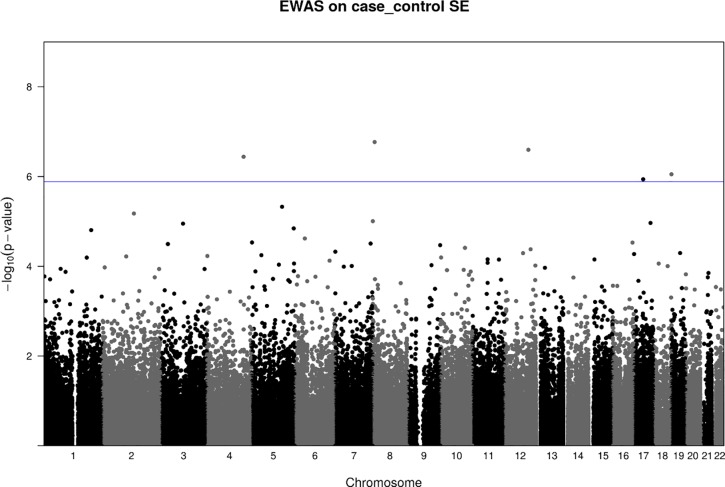
Fig 1. Manhattan plot of the EWAS results on umbilical cord methylation profiles.
Each point represents a CpG site (n = 160,419) with the chromosomal position along the x-axis and the negative logarithm of the associated p value on the y-axis. The solid blue horizontal line indicates FDR at 5%, which was 1.30 × 10⁻⁶ in this study. The results were from linear regression of methylation on case-control groups adjusted by covariates including child gender, ethnicity, cell types, bisulfite conversion batch and gestational age. Data showed there were 5 CpGs above the line of FDR corrected p-value after adjusting by covariates.

