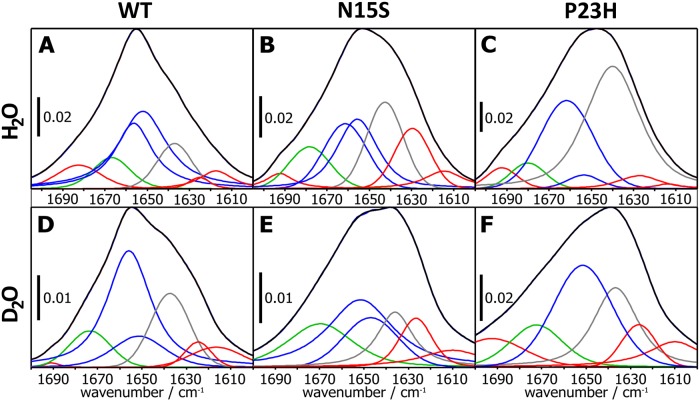
Fig 4. The FTIR amide I band region along with the deconvoluted spectra corresponds to different secondary structure fractions of the three samples.
A-C: Rhodopsin in H20, D-F: Rhodopsin in D20: A, D: WT; B, E: N15S; and C, F: P23H. Bands assigned to β-sheets are indicated red, β-turns green, α-helices blue, and random coil grey.

