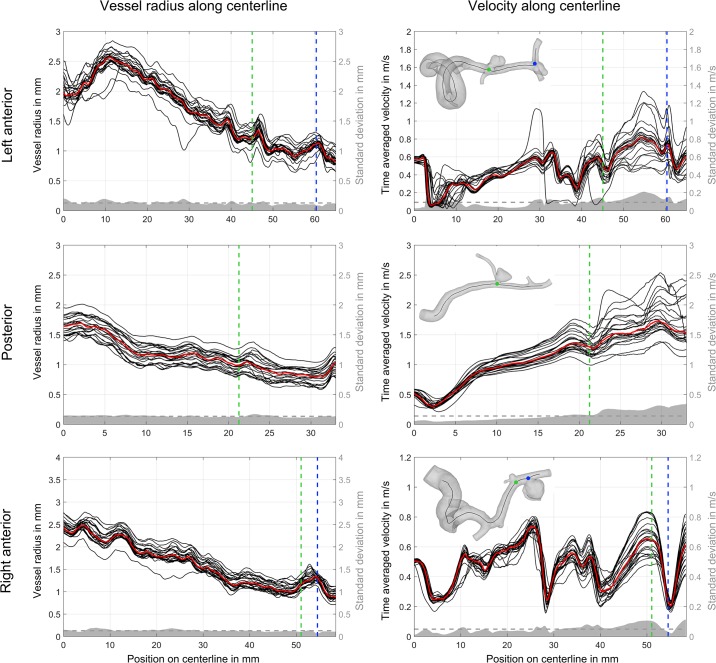
Fig 1. Comparison of vessel radius and velocity magnitude values for each group along the centerlines of the aneurysm carrying parent vessels in the anterior and posterior circulation.
Median radius and velocity is shown as a red line. The vertical dashed lines indicate the location of the corresponding aneurysm (aneurysm A and B in the right anterior, aneurysm C and D in the left anterior, and aneurysm E in the posterior circulation). Furthermore, the standard deviation is presented in gray with the mean value using a horizontal dashed line.

