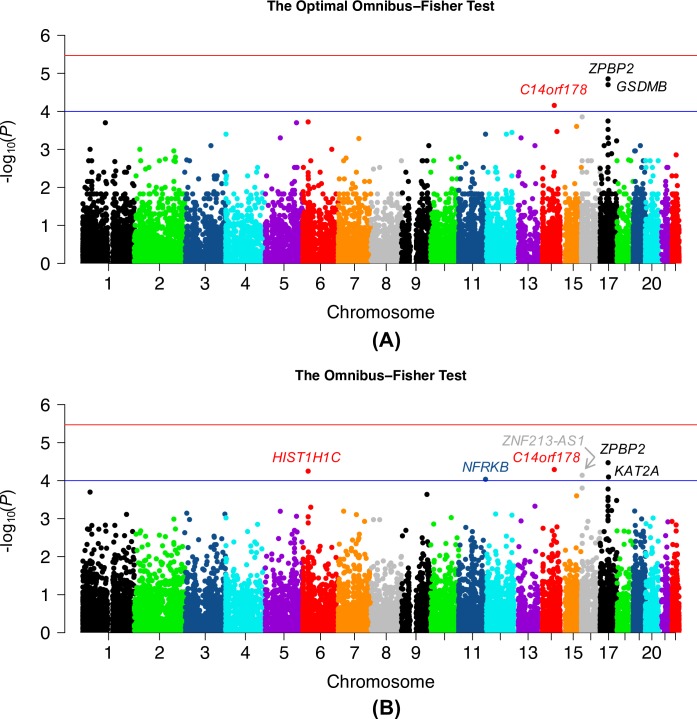
Fig 4. –log10(p-values) of the association between 14,808 genes and asthma status in WBCs.
(A) The optimal Omnibus-Fisher test and (B) the regular Omnibus-Fisher test. The blue line is the suggestive significance level, 1×10⁻⁴, and the red line is the stringent Bonferroni-corrected significance level, P = 3.38×10⁻⁶.

