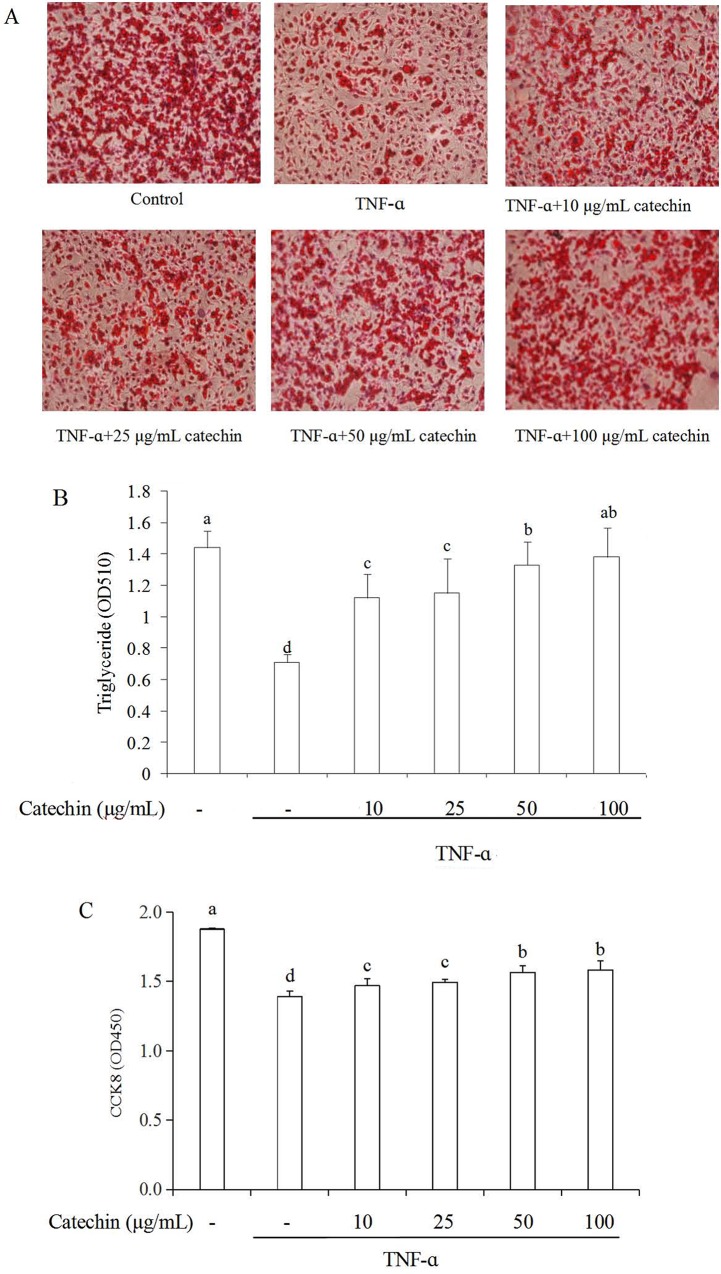
Fig 1. Effects of catechin on adipogenesis and cell viability in TNF-α (10 ng/mL) induced 3T3-L1 adipocytes.
(A) Lipid droplets in 3T3-L1 adipocytes treated with various concentrations of catechin were stained by Oil Red O; (B) The value of OD510 represents the content of intracellular triglyceride; (C) Cell viability of adipocytes treated with various concentrations of catechin was assayed by CCK8. Data bars with the unlike letters represent the significance differences (p < 0.05), with the same letters represent no significance difference (p > 0.05).

