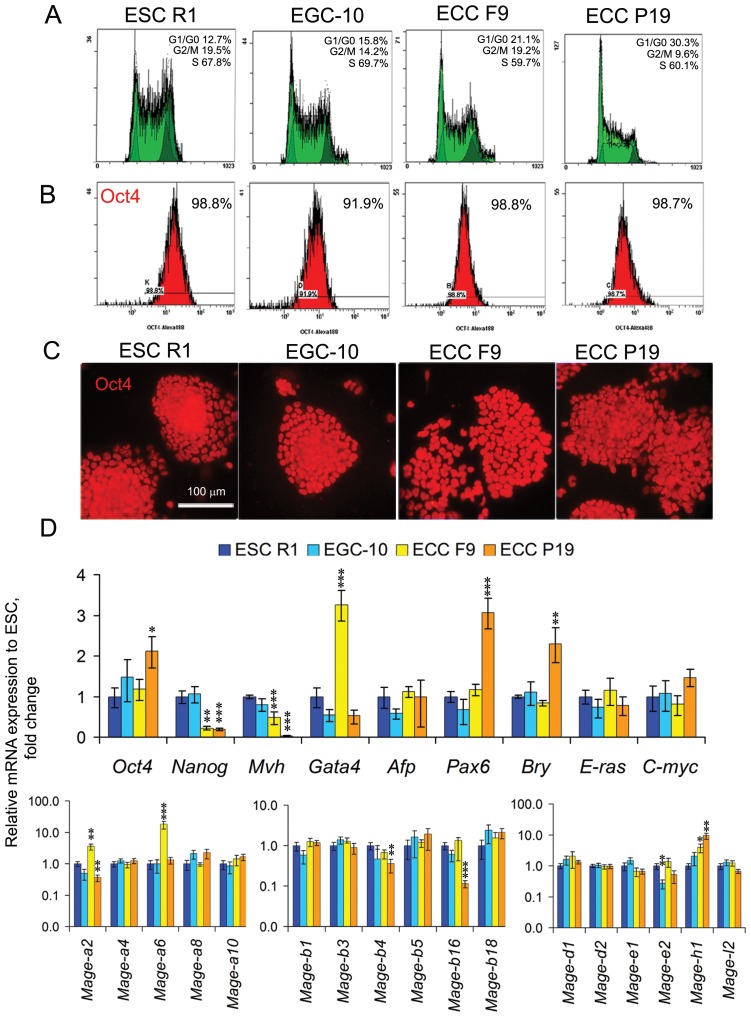
Figure 1. Characteristics and marker and Mage family gene expression patterns in undifferentiated ESCs, EGCs and ECCs.
(A) Flow cytometric analysis of the distributions of the cell cycle stages and (B) number of Oct4-expressing cells in the populations of undifferentiated ESCs, EGCs and ECCs. (C) Staining of undifferentiated ESCs, EGCs and ECCs with antibodies against Oct4. Scale bar = 100 μm. (D) Quantitative PCR analysis of the expression profiles of markers of proliferative activity (C-myc, E-ras), pluripotency (Oct4, Nanog), embryonic lineages (Mvh, Gata4, Afp, Pax6, Bry) and Mage family genes in undifferentiated ESCs, EGCs and ECCs. The gene expression levels (fold change) in EGCs, ECCs F9 and ECCs P19 were evaluated relative to the gene expression levels in ESCs R1. The data are represented as the means ± s.d., *p < 0.05, **p < 0.01, ***p < 0.01, ANOVA.

