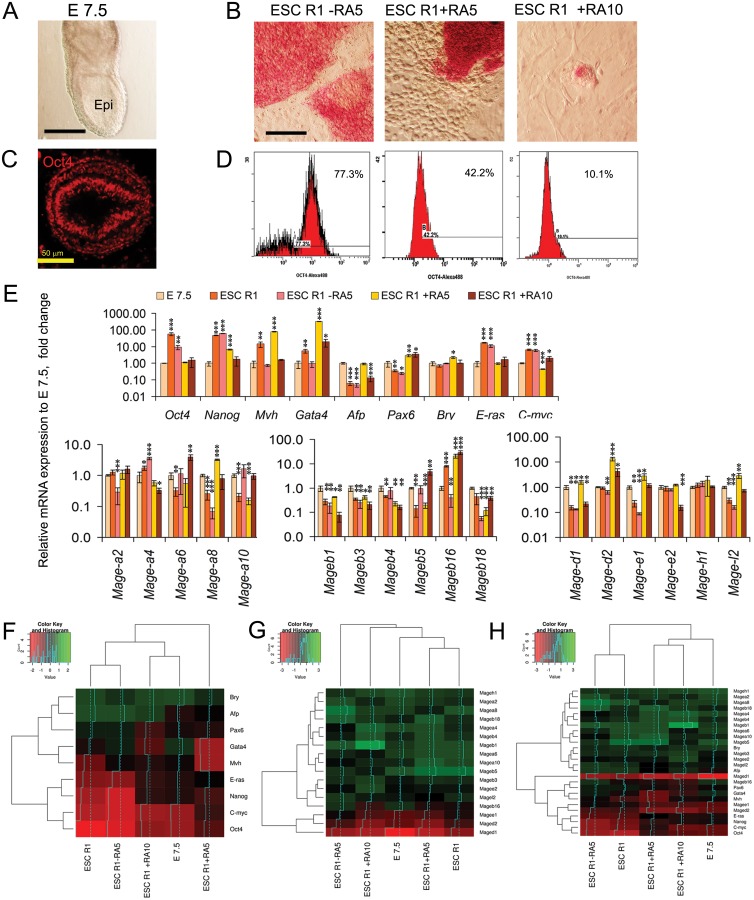
Figure 4. Comparative analysis of Mage family expression patterns in E7.5 mouse embryos and differentiating ESCs.
(A) The epiblast of mouse embryos at the E7.5 stage. Scale bar = 100 μm. (B) ALP activity in the spontaneously and RA-induced (for 5 and 10 days) differentiating ESCs. Scale bar = 100 μm. (C) Immunofluorescent analysis of Oct4-expressing cells in the epiblast of E7.5 mouse embryos (cross-section). Scale bar = 50 μm. (D) Flow cytometric analysis of Oct4-expressing cells in the spontaneously and RA-induced (for 5 and 10 days) differentiating ESCs. (E) The expression patterns of regulators of proliferation, pluripotency and embryonic lineages and Mage genes in E7.5 embryos and spontaneously and RA-induced (for 5 and 10 days) differentiating ESCs. The gene expression levels in differentiating ESCs R1 were evaluated relative to the gene expression levels in embryos at the E7.5 stage. The data are represented as the means ± s.d., *p < 0.05, **p < 0.01, ***p < 0.01, ANOVA. (F–G). Heatmaps and hierarchical clustering dendrograms based on the data (the averaged ΔCt values) on mutual gene expression profiles (H), gene-markers (F) and Mage family gene expression profiles (G) demonstrate the similarity/dissimilarity between the gene expression patterns of the E7.5 embryos and differentiating ESC populations.

