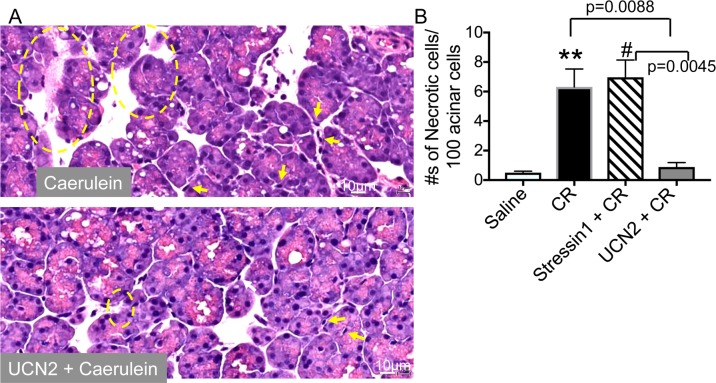
Fig 2. Histopathology and effect of UCN2 on cell necrosis.
(A) Representative micrographs showing H&E staining of pancreatic tissue sections. Necrotic cells are shown within yellow circles and arrows point to inflammatory cell infiltrates. Scale bar: 20μm. (B) Necrosis measurement: Necrosis was assessed on H&E stained pancreatic tissue sections using the following criteria- swollen cytoplasm, loss of plasma membrane integrity, and organelle leakage into interstitium. Data are shown as mean ± SEM (n = 3) for each condition. One-way ANOVA and Tukey’s multiple comparisons. CR: caerulein. **: p = 0.0059 Saline vs. CR; #: p = 0.0030 Saline vs. Stressin1 +CR.

