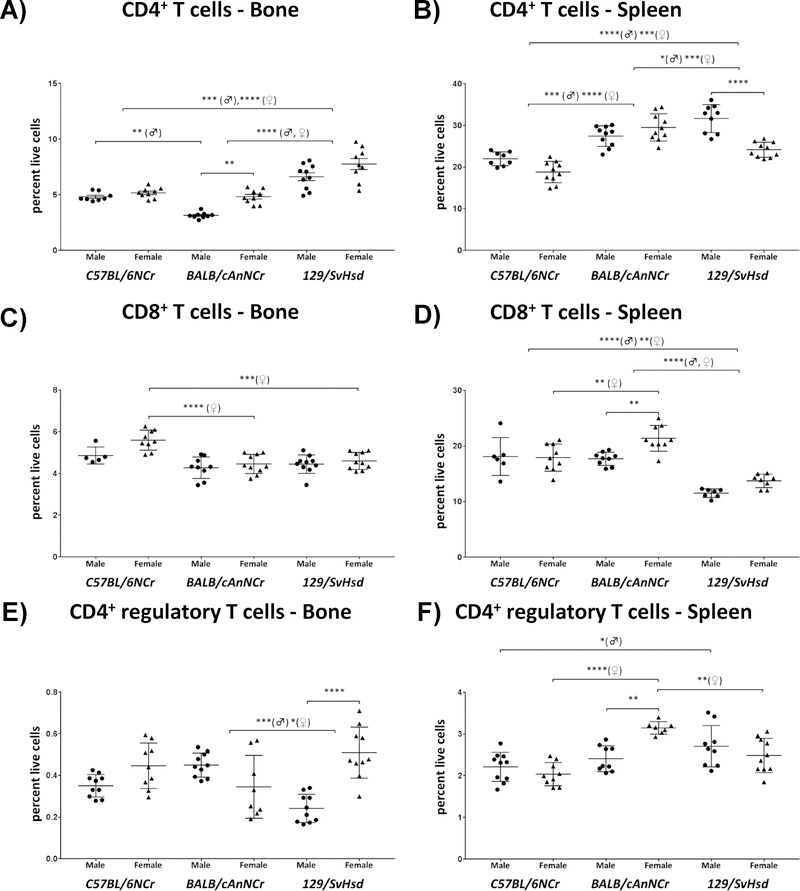
Figure 1: Immune cell distribution of T cells in C57BL/6NCr, BALB/cAnNCr and 129/SvHsd male and female mice.
Cell suspensions from BM and spleen were isolated from 8-week old mice. The cells were stained with CD3 and CD4 antibodies for CD4+ T cells, CD3 and CD8 antibodies for CD8+ T cells, and CD3, CD4, CD25 and FoxP3 antibodies for T-regs. The cells were then subjected to flow cytometry to determine cell-type percentages. (A) CD4+ T cells in BM, (n≥8). (B) CD4+ T cells in the spleen, (n≥8). (C) CD8+ T cells in BM, (n≥5). (D) CD8+ T in spleen, (n≥6). (E) CD4+ T-regs in BM, (n≥8). (F) CD4+ T-regs in spleen, (n≥7). Results, shown as scatter plots, depict average cell percentages (percent of live cells). Error bars denote SEM. Each dot represents the value from a single mouse. (♂) and (♀) represent male and female mice, respectively.*p ≤ 0.05, **p ≤ 0.01, ***p ≤ 0.001, ****p≤0.0001.

