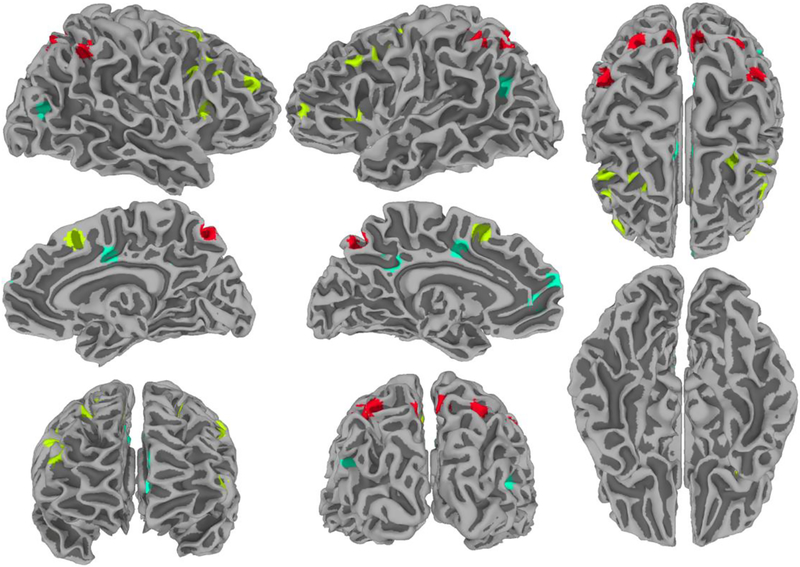
Figure 2:
Nodes used in the graph-theoretical analysis. Visualization of task-positive (parietal and frontal) and DMN regions of interest (ROIs) used in the modularity analysis. Parietal ROIs are shown in red, frontal ROIs are shown in yellow, and default ROIs are shown in turquoise. ROI generation was restricted to those voxels that showed a significant main effect of task difficulty. ROIs are displayed on a surface projection of the TT_N27 template of the AFNI package.

