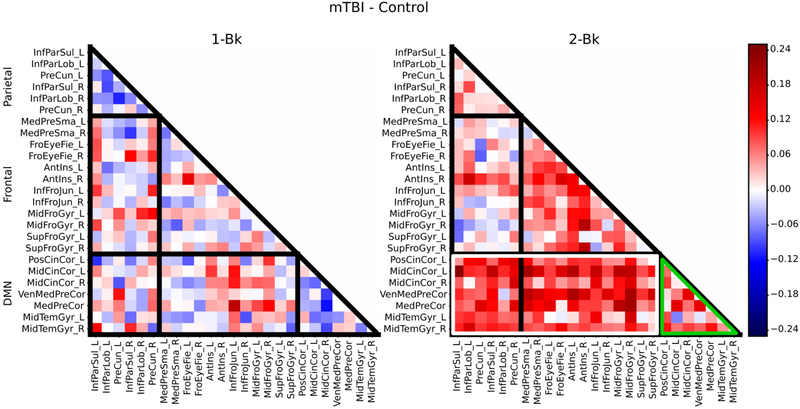
Figure 4:
Average correlation matrices illustrating both within and between network connectivity values for the subtraction of the mTBI group minus the control group for the 1-back condition (left) and the 2-back condition (right). During the 2-back condition, there was greater connectivity within the DMN regions (green outlines) as well as between DMN regions and task-positive regions (see white outlines) in the mTBI group compared to controls.

