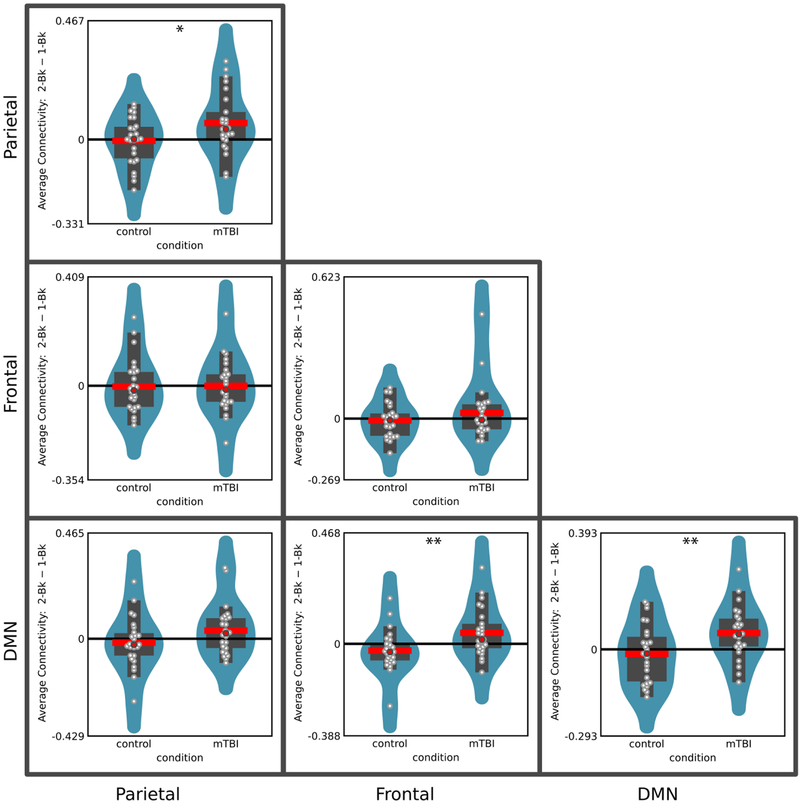
Figure 6:
Average within- and between-cluster functional connectivity was used to illustrate the interaction pattern between task difficulty and group conditions. Interactions between task difficulty and group conditions are noted with “*” (p<0.05, uncorrected) and “**” (p<0.05, Bonferroni corrected for multiple comparisons). For each group, the difference between the 2-back and 1-back is shown by violin plots. The violin shows a smoothed estimate of the distribution; the red line shows the mean; the red circle shows the median; the wider rectangle shows the inter-quantile range; the thinner rectangle shows 1.5 times the inter-quantile range (as long as it contains data points); the white circles show the actual data points.

