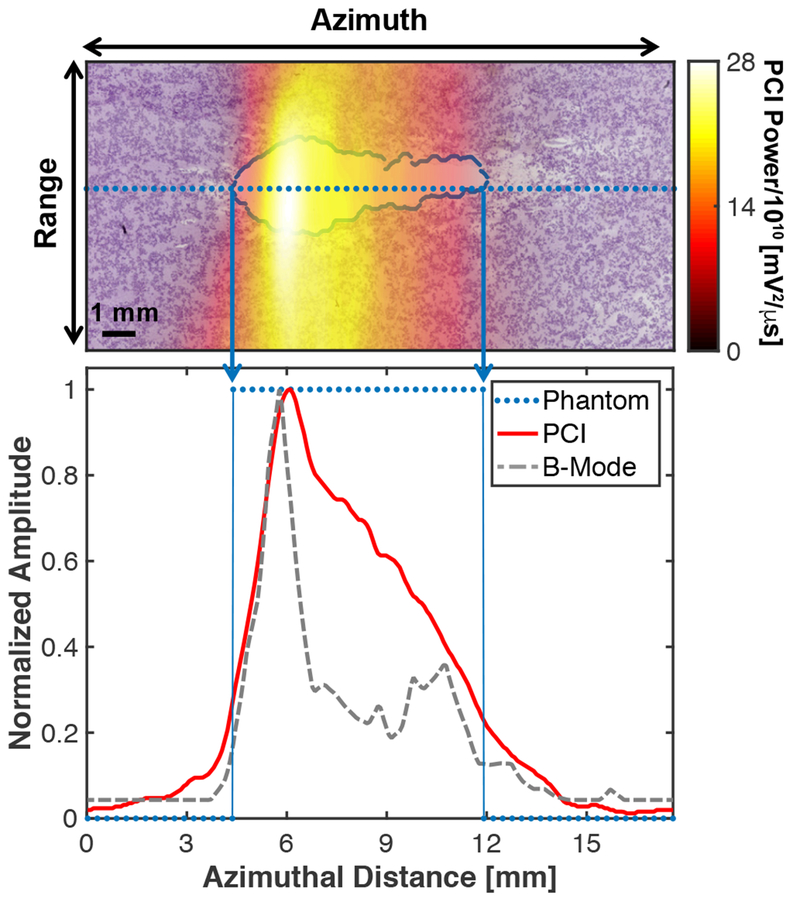
Fig. 15:
(Top panel) Passive cavitation image (PCI) registered with processed phantom image. The liquefaction zone border is outlined in blue. (Bottom panel) Comparison of the PCI and plane wave B-mode image along the dotted line in the top panel and binary phantom image. For the phantom, values of 1 indicate liquefaction, and values of 0 indicate intact phantom. The histotripsy pulse (1-MHz center frequency, 10-μs pulse duration, 18 MPa peak negative pressure) was propagating from left to right in the image (Bader et al. 2018).
Reprinted with permission from IEEE Transactions on Medical Imaging, vol. 37, Bader et al, Post hoc analysis of passive cavitation imaging for classification of histotripsy-induced liquefaction in vitro, p. 408, doi: 10.1109/TMI.2017.2735238. Copyright (2018), © IEEE.

