. 2019 May 3;8:e46003. doi: 10.7554/eLife.46003

Figure 1. The Pom1 gradient is formed by time-averaging of clusters that transiently bind the cortex.

(A) Schematic of the Cdr2-Pom1-Wee1 signal transduction pathway and its coarse cellular localization. (B) Individual frame (top panel) and sum projection (bottom panel) of a high-speed TIRF microscopy movie. Movie was continuous 15 s time-lapse acquisition of 200 ms exposures. Scale bar 1 µm. Blue arrows mark position of line scans performed for data in panel (D). (C) Pom1-mNG also forms clusters at the cell tip. Image is a sum projection of three consecutive 200 ms exposures from continuous time-lapse TIRF movie of the cell tip as depicted in the cartoon diagram. Scale bar 1 µm. (D) Line scans of fluorescence intensity along the long axis of the snap shot (blue line, left Y axis) and projection images (red line, right Y axis) in panel (B). Note that time-averaging of Pom1 clusters smoothens the concentration gradient. (E) Comparison of Pom1 cluster binding frequency at the cell tip or side (****p=<0.0001, n = 10 cells, 42–170 traces/cell). (F) Comparison of cortical dwell time of individual Pom1-mNG clusters (n.s., p=0.6747, n = 10 cells, 42–170 traces/cell) at the cell tip or side. For (E–F), each data point represents a single cell mean, and line and error bars represent mean and standard deviation of all cells. Statistical significance was tested using a Student’s T-test.

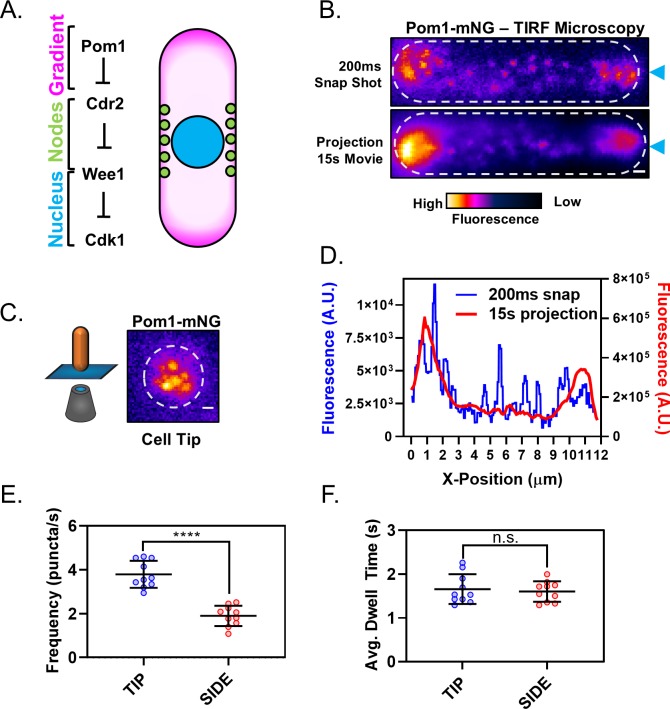
Figure 1.

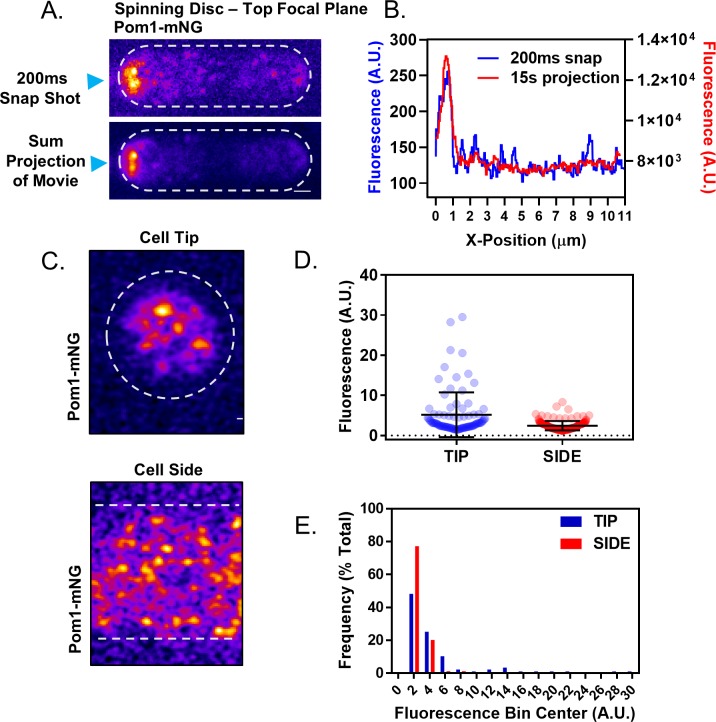
Figure 1—figure supplement 1. Analysis of the Pom1 gradient by confocal microscopy.

Figure 1—figure supplement 1.

(A) Pom1-mNG clusters are apparent at the lateral cell cortex of cells in individual frames (200 ms) of spinning-disc microscopy movies (top panel) but become averaged out in a projection of the entire movie (bottom panel). Sum projection is of a continuous 15 s time-lapse acquisition of 200 ms exposures at the top cell focal plane. Scale bar 1 µm. (B) Line scans of fluorescence intensity along the long axis of the cell in the snap shot (blue line, left Y axis) and projection image (red line, right Y axis) at positions marked by blue arrow heads in panel (A). Note that time-averaging of Pom1 clusters smoothens the concentration gradient. (C) Representative images of Airyscan super-resolution micrographs of Pom1-mNG at cell tip or side. Scale bar, 1 µm. (D) Fluorescence intensities of all single clusters resolved in Airyscan images as in panel (C). Data points represent individual cluster values, error bars are the mean and standard deviation (n = 87 tip, 158 side). (E) Histogram of the fluorescence intensity of individual Pom1 clusters at the cell tip and cell side. Clusters were binned by fluorescence intensity and displayed as a population frequency (n = 48 tip, 158 side).

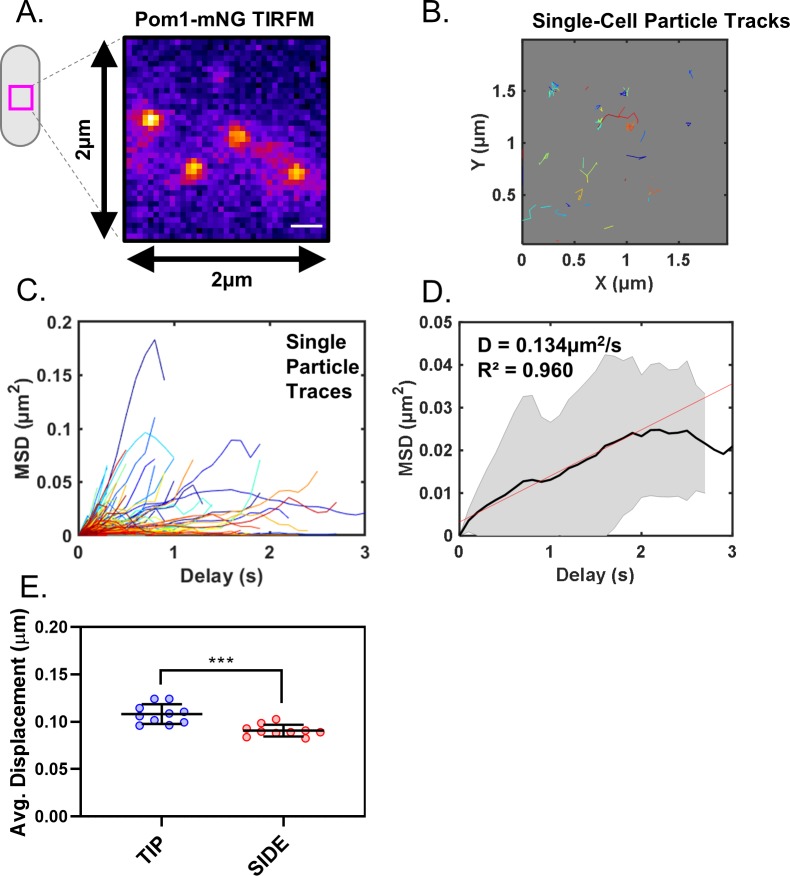
Figure 1—figure supplement 2. Analysis of Pom1 cluster diffusion.

Figure 1—figure supplement 2.

(A) Pom1-mNG clusters positioned at the cell middle, in a 2 × 2 µm ROI as used for particle tracking. (B) Single-particle diffusion traces of Pom1-mNG clusters show limited lateral diffusion in cells. (C) Mean squared displacement (MSD) curves calculated from traces of individual Pom1-mNG cluster diffusion as in panel (B). (D) Mean MSD curves generated from averaging of 439 single-particle traces, coming from six different cells. Linear regression of the initial linear segment (red line) of the curve provides the diffusion coefficient D = 0.134 ± 0.017 µm2/s. Black line represents the weighted mean of all traces, and gray lines indicate standard deviation. (E) Average life-time displacement of individual clusters (***p=0.0002, n = 10 cells, 42–170 traces/cell). Line and error represent mean and standard deviation. Statistical significance was tested using a Student’s T-test.