. 2019 May 3;8:e46003. doi: 10.7554/eLife.46003

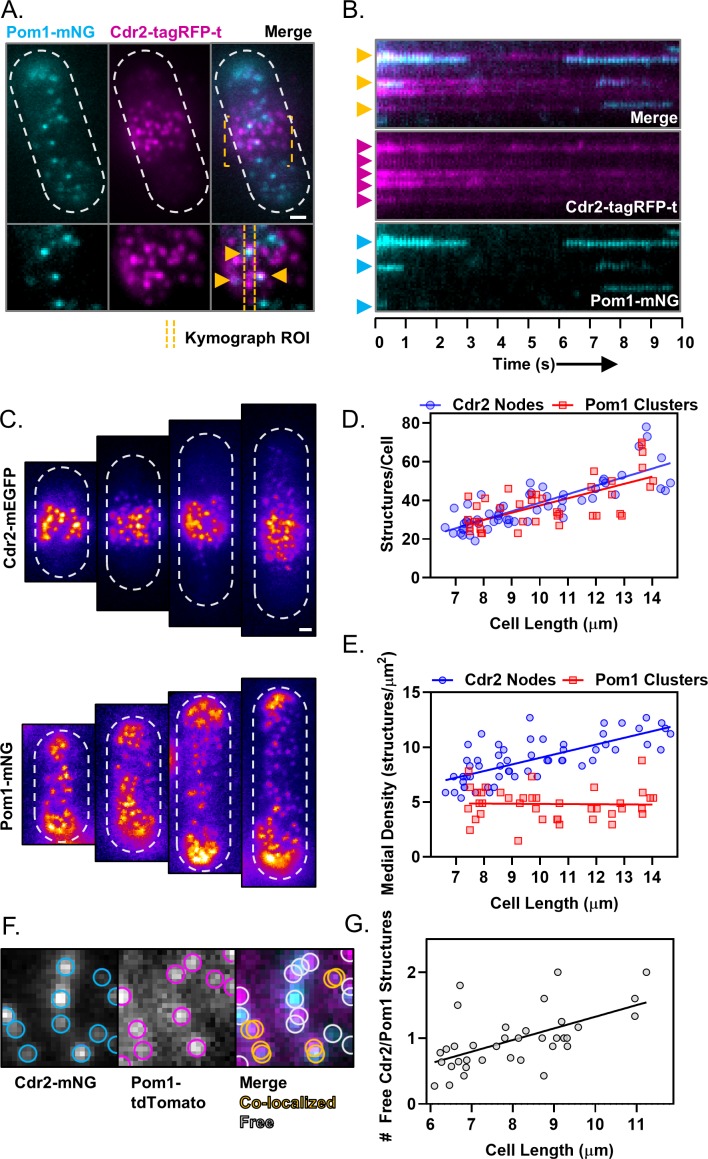
Figure 4. Size-scaling of Pom1 clusters and Cdr2 nodes at the lateral cell cortex.

(A) A subset of Pom1 clusters colocalize with Cdr2 nodes. Panels are TIRF microscopy images of cells expressing Pom1-mNG and Cdr2-tagRFP-t. Yellow dashed brackets outline the ROI of the lower zoomed panels. Orange arrows point to Pom1 clusters colocalized with Cdr2 nodes. Scale bar is 1 µm. (B) Kymographs generated using the ROI indicated in panel A. Cyan arrows indicate prominent Pom1 clusters, magenta arrows indicate prominent Cdr2 nodes, and orange arrows indicate colocalization. (C) Localization of Cdr2-mEGFP (upper panels) or Pom1-mNG (lower panels) in representative cells of increasing size, imaged by TIRF microscopy. Scale bar is 1 µm. (D) Total number of Cdr2-mEGFP nodes (blue circles) or Pom1-mNG clusters (red squares) measured per cell. Quantification is limited to clusters detected and resolvable in the TIRF illumination field. The slopes of the corresponding linear regressions are not significantly different (p=0.3757, n > 40 cells). (E) Density of Cdr2-mEGFP nodes (blue circles) or Pom1-mNG clusters (red squares) in 2 × 2 µm square ROIs at the cell middle, counted using TIRF microscopy. The slopes of the corresponding linear regressions are significantly different (p<0.0001, n > 40 cells). (F) Example of colocalization analysis for Pom1 clusters (magenta ROI) and Cdr2 nodes (cyan ROI) (left panels). Colocalized structures are marked with overlapping yellow ROIs, whereas non-colocalizing structures are marked with gray ROIs (right panel, gray circles). (G) Ratio of free Cdr2 nodes to free Pom1 clusters, plotted as a function of cell size. The slope of the linear regression is positive and significantly non-zero (p=0.0002, R2 = 0.33, n = 36 cells).

Figure 4.

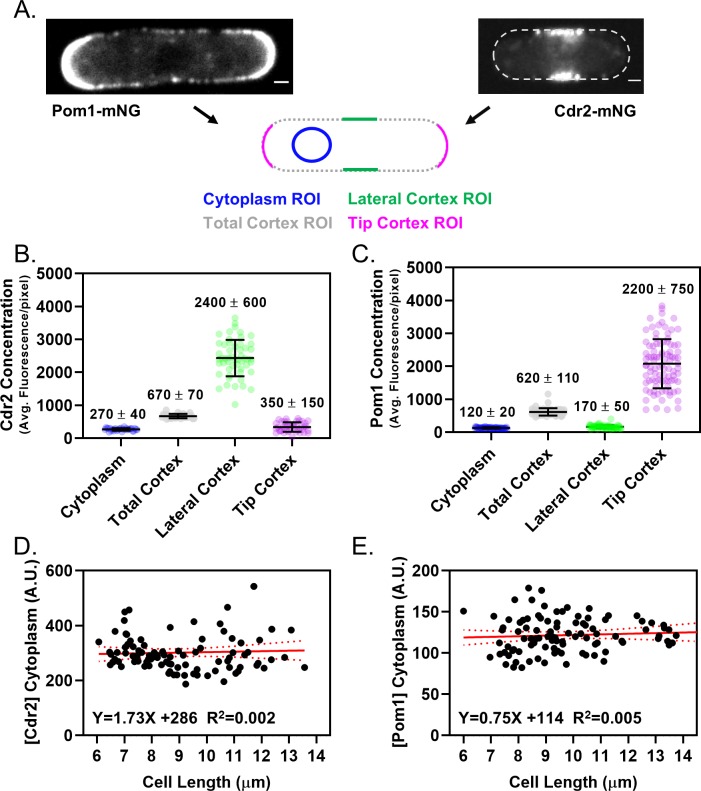
Figure 4—figure supplement 1. Quantification of Pom1 and Cdr2 concentration in different cellular regions.

Figure 4—figure supplement 1.

(A) Schematic showing the ROI locations used to measure the concentration of Pom1-mNG or Cdr2-mNG in the cytoplasm, cortex, tip cortex, or side cortex. Images are spinning disc confocal micrographs of middle cell focal planes. Scale bars 1 µm. (B) Quantification of Cdr2 concentration (average fluorescence per pixel) at different cellular ROIs as in panel (A). Each dot represents a measurement from a different cell, numbers and the line and error represent the mean and standard deviation. (C) Quantification of Pom1 concentration (average fluorescence per pixel) at different cellular ROIs as in panel A. Each dot represents a measurement from a different cell, numbers and the line and error represent the mean and standard deviation. (D) Quantification of the cytoplasmic concentration (average fluorescence per pixel) of Cdr2-mNG as a function of cell length, using a cytoplasmic ROI as in panel (A). The slope of the linear regression does not significantly deviate from zero (b1≠0, (n.s.) p=0.6449). Each point indicates a measurement from a single cell. (E) Quantification of the cytoplasmic concentration (average fluorescence) of Pom1-mNG as a function of cell length, using a cytoplasmic ROI as in panel (A). The slope of the linear regression does not significantly deviate from zero (b1≠0, (n.s.) p=0.4926). Each point indicates a measurement from a single cell.
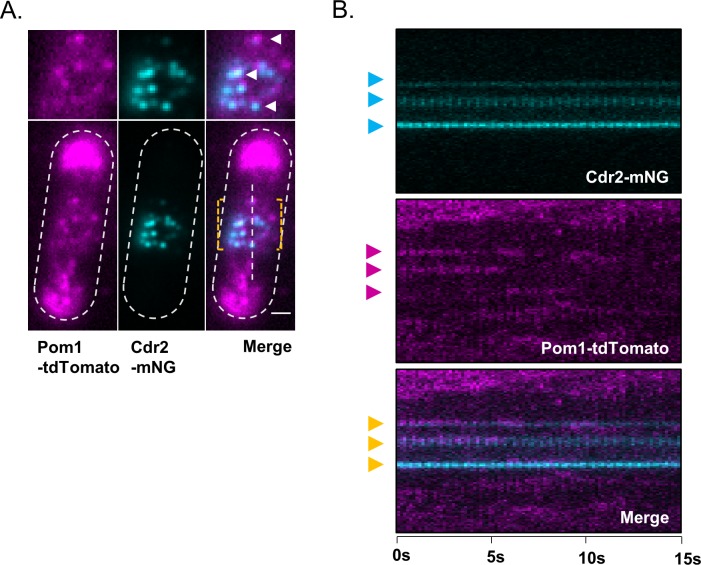
Figure 4—figure supplement 2. Colocalization of Cdr2 nodes and Pom1 clusters using alternative fluorophore pair.

Figure 4—figure supplement 2.

(A) A subset of Pom1 clusters colocalize with Cdr2 nodes. Images are dual-channel simultaneously-acquired TIRF microscopy images of cells expressing Pom1-tdTomato and Cdr2-mNeonGreen. Yellow dashed brackets outline the ROI of the lower zoomed panels. White arrows point to Pom1 clusters colocalized with Cdr2 nodes. Scale bar is 1 µm. (B) Kymographs generated using the ROI drawn on the merged image in panel A. Cyan arrows indicate prominent Cdr2 nodes, magenta arrows indicate prominent Pom1 clusters, and orange arrows adjacent to the merged kymograph indicate colocalization.
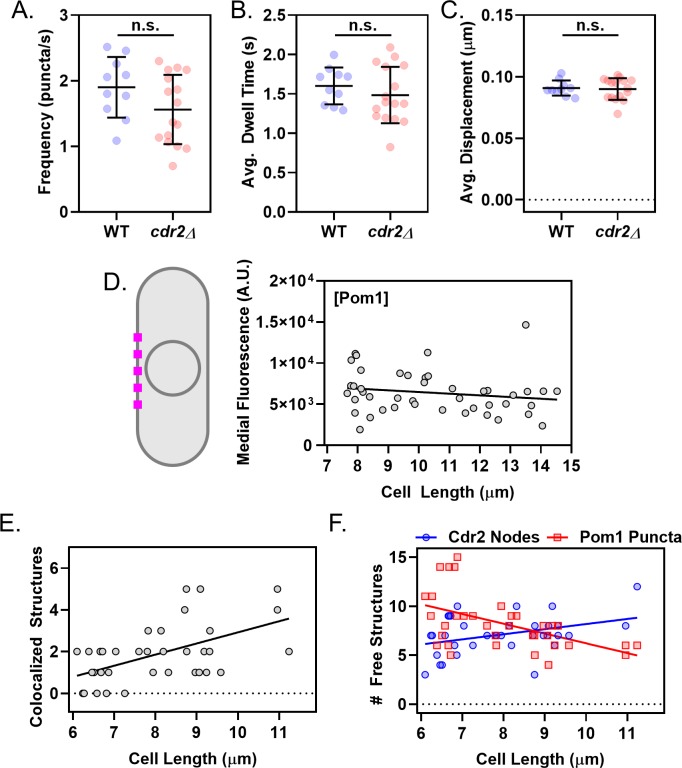
Figure 4—figure supplement 3. Supporting analysis of Cdr2 nodes and Pom1 clusters at the medial cell cortex.

Figure 4—figure supplement 3.

(A) Comparison of Pom1 cluster binding frequency on the cell sides of wild-type and cdr2∆ cells (n.s., p=0.1076, n > 10 cells, 25–42 traces/cell). (B) Comparison of Pom1 cluster binding duration on the cell sides of wild-type and cdr2∆ cells (n.s., p=0.371, n > 10 cells, 25–42 traces/cell). (C) Comparison of Pom1 cluster displacement on the cell sides of wild-type and cdr2∆ cells (n.s., p=0.8191, n > 10 cells, 25–42 traces/cell). In A-C, significance was tested using a Student’s T-test. (D) Schematic and quantification of Pom1 concentration at the lateral cell cortex measured by confocal microscopy, using 2 µm line scans at the cell middle from images such as Figure 4—figure supplement 1A. The slope of the linear regression is negative, but not significantly non-zero (p=0.2603, R2 = 0.03, n = 45 cells). (E) Plot of the number of colocalized structures as a function of cell size. The slope of the linear regression is significantly non-zero (p=0.0006, R2 = 0.3, n = 36 cells). (F) Plot of free, non-colocalized Cdr2 nodes (blue circles) and free Pom1 clusters (red squares). The slope of the linear regression of #Pom1 clusters versus cell length is negative, and significantly non-zero (p=0.001, R2 = 0.27, n = 36 cells). The slope of the linear regression of #Cdr2 nodes versus cell length is positive, and significantly non-zero (p=0.021, R2 = 0.15, n = 36 cells).