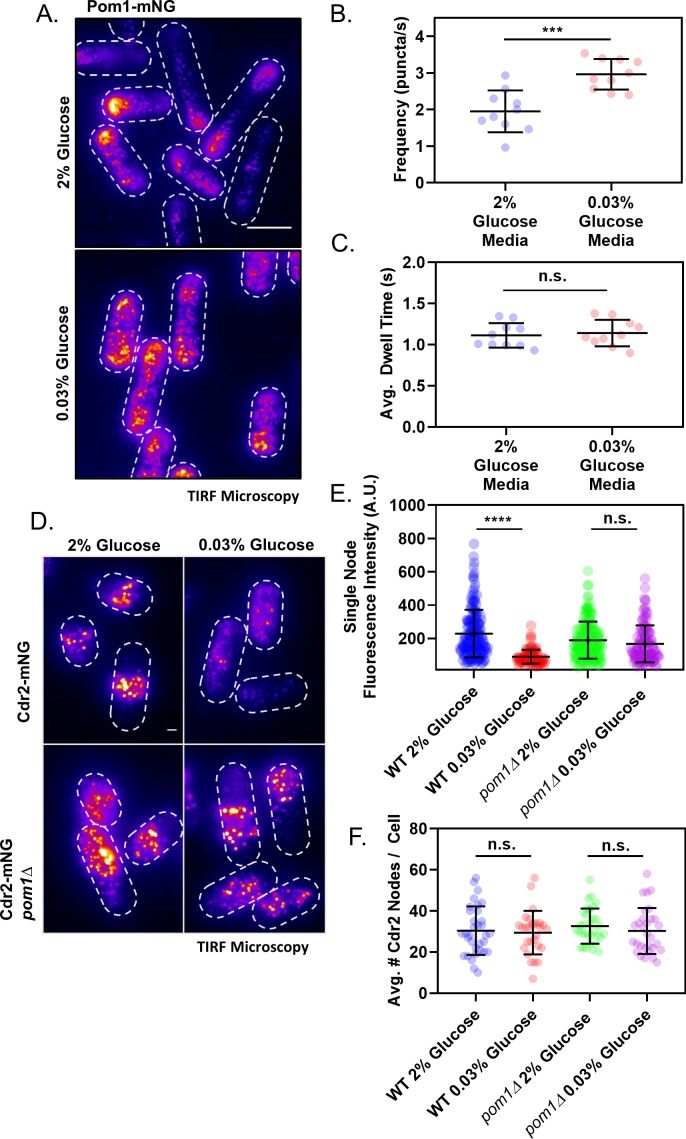
Figure 5. Redistribution of Pom1 clusters to the lateral cortex disrupts Cdr2 nodes during glucose restriction.
(A) Localization of Pom1-mNG in cells grown in either high (2%) or low (0.03%) glucose media. Images were collected using TIRF microscopy. Scale bar, 5 µm. (B) Comparison of the binding frequency of Pom1 clusters at the lateral cell cortex in cells grown under high and low glucose (***p=0.0003, n = 10 cells, 32–113 traces/cell). Statistical significance was tested using a Student’s T-test. (C) Comparison of the binding dwell time of Pom1 clusters at the lateral cell cortex in cells grown under high and low glucose (n.s., p=0.6833, n = 10 cells, 32–113 traces/cell). Statistical significance was tested using a Student’s T-test. (D) Localization of Cdr2-mNG in wild-type or pom1∆ cells grown in either normal (2%) or low (0.03%) glucose media. Images were collected using TIRF microscopy. Scale bar, 1 µm. (E) Comparison of the fluorescence intensity of individual Cdr2-mNG nodes in wild-type or pom1∆ cells grown in either normal (2%) or low (0.03%) glucose media. Low glucose induces partial node disassembly in wild-type cells (****p<0.0001, n = 92–169 nodes from >5 cells) but not in pom1∆ cells (n.s., p=0.4015, n = 113–156 nodes from >5 cells). Measurements were taken from Airyscan Super-Resolution confocal micrographs. (F) Quantification and comparison of the total number of Cdr2-mNG nodes visible in TIRF micrographs of wild-type or pom1∆ cells grown in either normal (2%) or low (0.03%) glucose media. There is no significant difference in any condition (p>0.05, n = 28–33 cells). Statistical significance was tested using a one-way ANOVA.


