. 2019 May 8;8:e45815. doi: 10.7554/eLife.45815

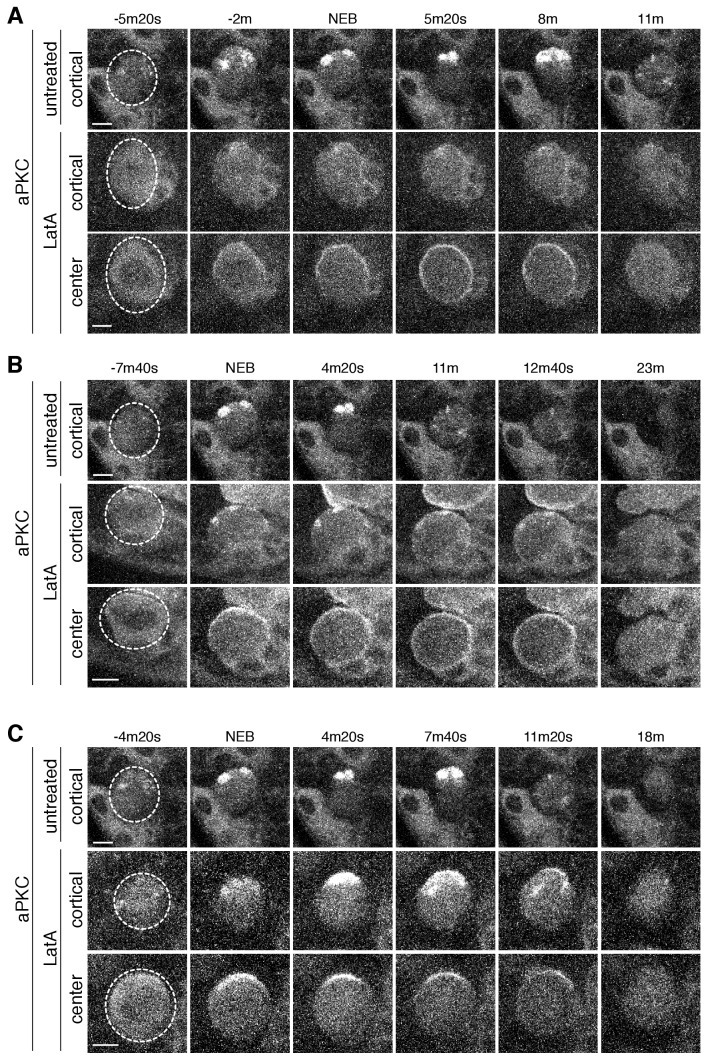
Figure 4. aPKC cortical dynamics following disruption of the actin cytoskeleton.

(A) Effect of treating a neuroblast with LatA beginning in interphase (24m20s prior to NEB) on aPKC localization dynamics. Frames from Figure 4—video 1 are shown as 4 µm maximum intensity projections along the cortical edge and center of aPKC-GFP taken from Figure 4—video 1. The cortical projections from an untreated neuroblast at equivalent time points are shown for reference in the top row. The neuroblast is highlighted by a dashed circle in the first column. Time is shown relative to nuclear envelope breakdown (NEB). Scale bar 5 µm. (B) Effect of treating a neuroblast with LatA following the initial cortical recruitment events (7m20s prior to NEB) on aPKC localization dynamics. Frames from Figure 4—video 2 are shown as in panel A. (C) Effect of treating a neuroblast with LatA following cap coalescence (4 m prior to NEB) on aPKC localization dynamics. Frames from Figure 4—video 3 are shown as in panel A.

Figure 4.

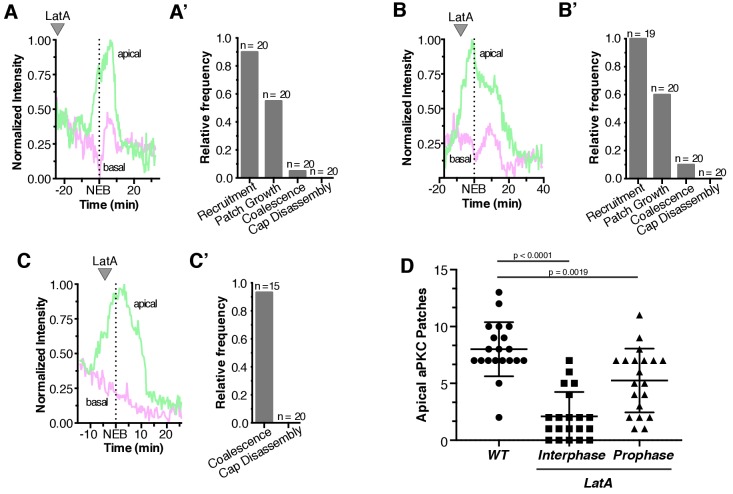
Figure 4—figure supplement 1. Quantification of Latrunculin A effects on aPKC localization dynamics.

Figure 4—figure supplement 1.

(A) Effect of treating an interphase neuroblast with LatA on aPKC localization. Normalized apical and basal cortical intensity is shown from Figure 4—video 1. (A’) The frequency of neuroblasts treated with LatA in interphase that exhibit any aPKC recruitment to the cortex (‘Recruitment’), growth of foci into patches (‘Patch Growth’), coalescence of patches into an apical cap (‘Coalescence’), and cap disassembly, are shown. Frequency is relative to wild type neuroblasts (wild type neuroblasts exhibit each effect with a frequency of 1.0; n = 20). (B) Effect of treating a neuroblast with LatA following the initial cortical recruitment events on normalized apical and basal cortical aPKC intensity (from Figure 4—video 2). (B’) The frequency of neuroblasts treated with LatA following the initial cortical recruitment events that exhibit characteristics of the neuroblast polarity cycle, as in panel A’. (C) Effect of treating a neuroblast with LatA near cap coalescence on normalized apical and basal cortical aPKC intensity (from Figure 4—video 3). (C’) The frequency of neuroblasts treated with LatA near cap coalescence that exhibit characteristics of the neuroblast polarity cycle, as in panel A’ (‘Recruitment’ and ‘Patch Growth’ phases are not shown because they are completed by metaphase). (D) Number of apical aPKC patches in wild type neuroblasts and those treated with LatA either in interphase or prophase. Error bars represent one standard deviation from the mean. Statistical significance was calculated using a two-tailed t-test. Data are included in Figure 4—figure supplement 1—source data 1.
Figure 4—figure supplement 1—source data 1. Apical patches in untreated and LatA treated neuroblasts.
DOI: 10.7554/eLife.45815.013
Figure 4—video 1. Effect of interphase LatA treatment on aPKC localization dynamics.
Download video file (8.6MB, mp4)
DOI: 10.7554/eLife.45815.012
A neuroblast is shown from a Drosophila larval brain explant treated with LatA 24 minutes and 20 seconds before the neuroblast underwent nuclear envelope breakdown. The montage includes maximum intensity projections of aPKC-GFP signal through the entire cell (upper left), cortical edge (upper right), and center (lower right). Histone H2A-RFP signal is shown in the bottom left. Time is relative to nuclear envelope breakdown.
Figure 4—video 2. Effect of LatA treatment following cortical recruitment on aPKC localization dynamics.
Download video file (3.4MB, mp4)
DOI: 10.7554/eLife.45815.011
A neuroblast is shown from a Drosophila larval brain explant treated with LatA 7 min and 20 s before the neuroblast underwent nuclear envelope breakdown. The montage includes maximum intensity projections of aPKC-GFP signal through the entire cell (upper left), cortical edge (upper right), and center (lower right). Histone H2A-RFP signal is shown in the bottom left. Time is relative to nuclear envelope breakdown.
Figure 4—video 3. Effect of LatA treatment following apical cap coalescence on aPKC localization dynamics.
Download video file (3.4MB, mp4)
DOI: 10.7554/eLife.45815.010
A neuroblast is shown from a Drosophila larval brain explant treated with LatA 4 min before the neuroblast underwent nuclear envelope breakdown. The montage includes maximum intensity projections of aPKC-GFP signal through the entire cell (upper left), cortical edge (upper right), and center (lower right). Histone H2A-RFP signal is shown in the bottom left. Time is relative to nuclear envelope breakdown.