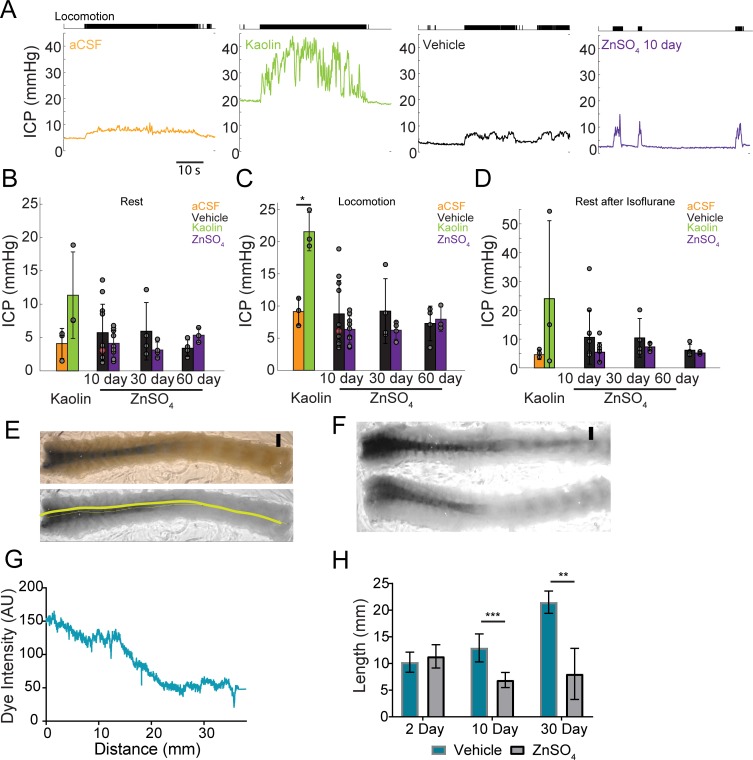
Figure 10. Intranasal ZnSO4 treatment does not affect ICP but decreases CSF movement down the spinal column.
(A) Left panel, example trace showing intracranial pressure (ICP) change during a locomotion bout in an animal that has been injected with aCSF in the cisterna magna. The ICP becomes elevated slightly over baseline when the animal moves, consistent with previous results (Gao and Drew, 2016). The tick marks in the upper panel indicates locomotion events, defined as times where the treadmill acceleration exceeds a thereshold (Huo et al., 2014). Subsequent panels show ICP change during locomotion in animals injected with Kaolin, vehicle control, or ZnSO4 treatment, respectively. (B–D) Mean ± standard deviation plotted. Circles represent individual animals. (B) Mean of each group of ICP during rest (1 hr after isoflurane) after kaolin injection (Kaolin) and 10, 30, and 60 days after treatment (ZnSO4). The orange shaded circle indicates the same animal showing in (A). (C) Same as (B) but for ICP during locomotion. Comparison of ICP during locomotion for aCSF and kaolin injected mice (t(4) = 5.88, p=0.0042, n = 3 for each group, ttest2). (D) Same as (B) but for stationary (resting) periods in the 2 min immediately after the cessation of isoflurane. (B–D) No statistically significant differences were observed between ZnSO4-treated and control animal at rest or during locomotion for all treatment durations (Table 2). (E) Top panel: A decalcified and SeeDB-cleared spinal column after a cisterna magna EB injection. Bottom panel: Red channel only displaying the trace (yellow line) used for quantifying pixel intensity. Scale bar 2 mm. (F) Vehicle (top) and 10 days after ZnSO4 treatment (bottom) decalcified and SeeDB cleared spinal columns after cisterna magna EB injection. (G) Trace obtained and graphed to display dye intensity of EB along the spinal column (distance) quantified after cisterna magna injections. (H) Comparisons of the distance of dye movement along the spinal column after an EB cisterna magna injection in mice intranasally treated with vehicle or ZnSO4, 2 (t(5) = 0.6921, p=0.5197, n = 3 vehicle and n = 4 treated, ttest2), 10 (t(12) = 5.069, p=0.00028, n = 8 vehicle and n = 6 treated, ttest2), and 30 days (t(9) = 4.571, p=0.00134, n = 3 vehicle and n = 8 treated, ttest2), after treatment. Mean ± standard deviation plotted. *p≤0.05 **p≤0.01 ***p≤0.001.

