. 2019 May 7;8:e44278. doi: 10.7554/eLife.44278

Figure 3. Localization of lymphatic vessels at the cribriform plate and olfactory bulb junction.

For schematics: olfactory nerve (ON), neuroepithelium (NE), cribriform plate (CP), olfactory bulb (OB) and glomeruli (yellow circles). D = dorsal, R = rostral, M = medial, and L = lateral. (A) Schematic of the sagittal plane of the mouse skull and brain showing the relationship of the OB and nerve junction to the CP. (B) Sagittal view of the area within the pink box in (A), depicting OSNs crossing the CP and terminating in the OB and glomeruli. (C) Coronal view of the black dashed line in (A) illustrating the location of the CP relative to the OBs and NE. (D–K) Immunofluorescent staining: LYVE1 (magenta), FITC-albumin (green), and DAPI (blue) in LYVE1-tdtomato mice. (D–E) Localization of LYVE1+ vessels along the medial olfactory nerve, sagittal area indicated in (B), depicting LYVE1+/FITC-albumin negative vessels (putative lymphatic vessels) running parallel to the olfactory nerve. (F–G) Area indicated by green box in (B), magnified area of (D–E). (H) Localization of LYVE1+ vessels in the nasal epithelium and traversing the CP, coronal area indicated in (C). (I) Area indicated by purple box in (C), magnified area of (H), depicting LYVE1+ vessels traversing foramina of the CP. (J) Localization of LYVE1+ vessels and blood vessels (labeled with FITC-albumin) in the nasal epithelium and traversing the CP, coronal area indicated in (C). (K) Area indicated by purple box in (C), magnified area of (H), depicting only blood vessels (labeled with FITC-albumin) traversing foramina of the CP. (D–E, H, J) Scale bars 250 μm. (F–G, I, K) Scale bars 50 μm.

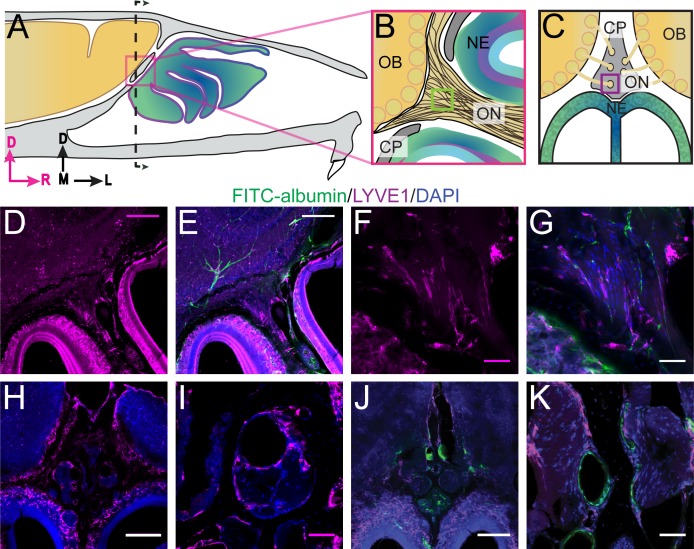
Figure 3.

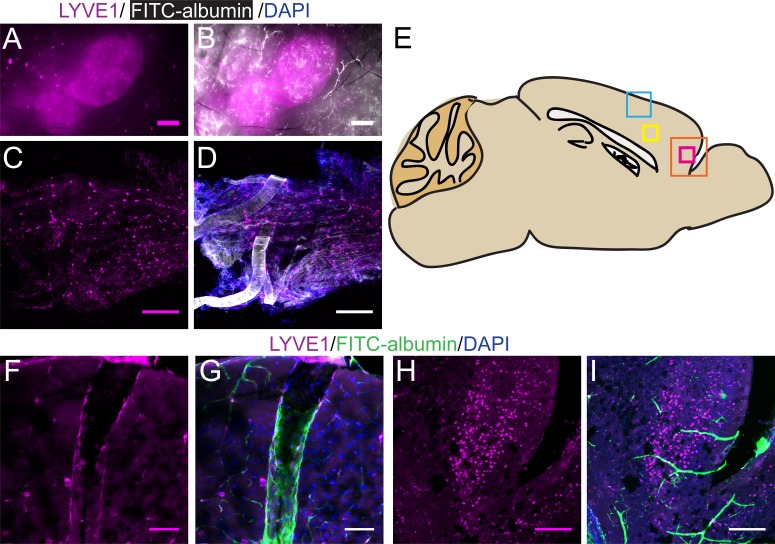
Figure 3—figure supplement 1. Lymphatic vessels in lymph nodes and dura express LYVE1, as do non-lymphatic vessels and cells in the brain.

Figure 3—figure supplement 1.

(A–D) LYVE1-GFP (Ai6) mice were used for these experiments. (A–B) Superficial lymph nodes in the neck: DiI (white) and LYVE1 (magenta). No cross-labeling is observed between DiI+ blood vessels and LYVE1+ lymphatic vessels. (C–D) Dura: DiI (white), LYVE1 (yellow), and DAPI (blue). (E) Schematic of the sagittal view of the mouse brain showing the ROIs for (F–I). (F–I) LYVE1-tdtomato (Ai14) mice were used for these experiments. FITC-albumin filled LYVE1-tdtomato mice. LYVE1 (magenta), FITC-albumin (green), and DAPI (blue). F–G) A penetrating vessel (FITC-albumin filled) with LYVE1+ vascular endothelial cells (F) in the upper layers of the cortex, area indicated by the blue box in (A). (H–I) A non-vascular cell of unknown type expressing LYVE1 in the frontal cortex (H), area indicated by orange box in (A). (A–B) Scale bar 500 μm. C–D, H–I) Scale bar 250 μm. (F–G) Scale bar 50 μm.
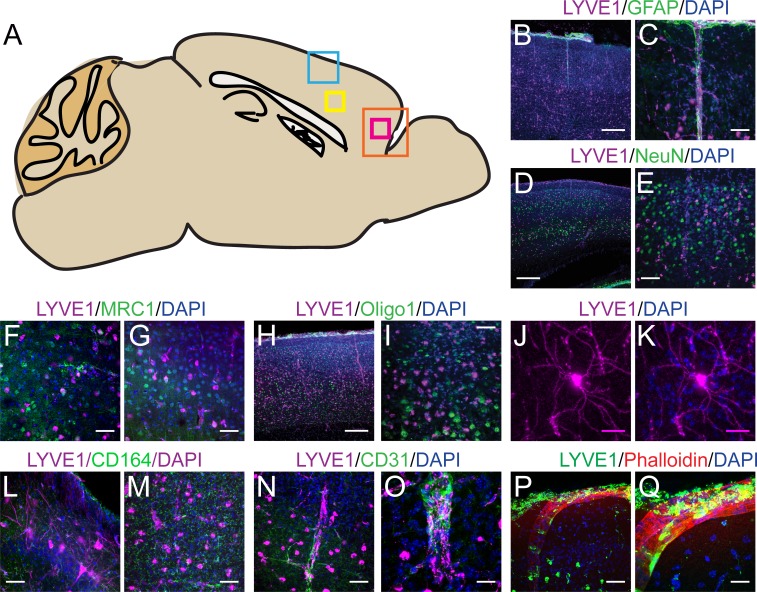
Figure 3—figure supplement 2. LYVE1 expression in the murine brain is not cell-type specific.

Figure 3—figure supplement 2.

(A) Schematic of the sagittal view of the mouse brain showing the ROIs for (B–Q). (B–Q) Immunofluorescence staining of GFAP, NeuN, MRC1, Oligo1, CD164, CD31, or Phalloidin in a LYVE1-GFP (Ai6) mouse in the cortex, in the area indicated by the blue box in (A), unless specified. (B) No overlap was observed between GFAP+ and LYVE1+ cells. (C) Zoomed in area in (B). (D) No overlap was observed between NeuN+ and LYVE1+ cells. (E) Zoomed in area in (D). (F) Minimal overlap was observed between MRC1+ and LYVE1+ cells in the area indicated by the pink box in (A). (G) Minimal overlap was observed between MRC1+ and LYVE1+ cells in the area indicated by the yellow box in (A). (H) No overlap was observed between Oligo1+ and LYVE1+ cells. (I) Zoomed in area in (H). (J–K) LYVE1+ cell of unknown type, area indicated by yellow box in (A). (L) No overlap was observed between CD164+ and LYVE1+ cells in the area indicated by the pink box in (A). (M) No overlap was observed between CD164+ and LYVE1+ cells in the area indicated by the yellow box in (A). (N) Overlap was observed between CD31+ and LYVE1+ cells in the area indicated by the blue box in (A). (O) Zoomed in area in (N). (P) Overlap was observed between Phalloidin and LYVE1+ cells in the area indicated by the blue box in (A). (Q) Zoomed in area in (N). (B, D, H) Scale bar 250 μm. (C, E–G, I, L–N, P) Scale bar 50 μm. (J–K) Scale bar 25 μm. (O, Q) Scale bar 20 μm.