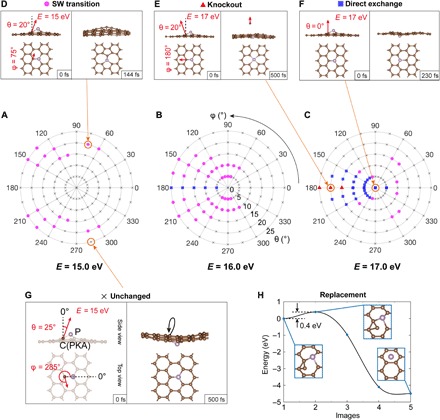
Fig. 2. Mechanisms of P dopant dynamics in graphene calculated with abMD.

(A to C) Angular distribution maps of different possible lattice transformations obtained when a C neighbor of the P impurity is given an initial out-of-plane momentum. The corresponding initial kinetic energies on the carbon, E, are (A) 15.0, (B) 16.0, and (C) 17.0 eV. The marks in these polar plots indicate the dynamical outcome: C knockout as red triangles, direct exchange as blue squares, SW transitions as magenta circles, and unchanged lattice as black crosses. As examples, snapshots of (D) SW transition (θ = 20°, φ = 75°, E = 15.0 eV), (E) C knockout (θ = 20°, φ = 180°, E = 17.0 eV), (F) direct exchange (θ = 0°, E = 17.0 eV), and (G) unchanged structure (θ = 25°, φ = 285°, E = 15.0 eV) are shown. The red arrows indicate the direction of the C momentum along the in-plane and normal-to-plane directions (lengths not to scale), with the definition of the spherical coordinate angles θ and φ shown in (G). (H) cNEB barrier for a proposed mechanism of P dopant replacement by C. Insets: The initial, saddle-point, and final configurations.
