
Fig. 4. PKS: A scheme for evaluating cross sections of different dynamic processes.
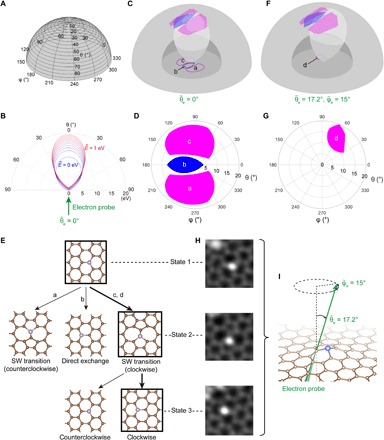
(A) The spherical coordinate system used for describing the PKS (with θ and φ defining the direction of momentum, and the radius defining the postcollisional kinetic energy, E, of the C neighbor). (B) A vertical cross section of the PKS showing the distribution of function f (dubbed “ovoid” hereafter) for the upward 60-keV electron beam () interacting with a moving PKA ( to 1 eV). (C) The ovoid of a vibrational PKA (we use eV here for the amplified illustration) intersects with different outcome areas, where in (D), the intersections are projected to a polar plot. The magenta areas marked with a and c represent SW transitions (clockwise and counterclockwise, respectively), and the blue area marked with b represents direct exchange. (E) A decision tree showing possible outcomes of the atom-electron interaction, where the probability of going through each path is proportional to the cross sections. (F) The PKS and the ovoid of a tilted electron beam () acting on a vibrational PKA ( eV), with (G) showing a different intersection projected to the polar plot. Here, only clockwise SW transitions are activated, marked with d in the magenta area. (H) An experimentally observed clockwise SW transition of a Si dopant activated in a tilted sample as in (F) and (G). Three corresponding stages are placed alongside the decision tree in (E), where the experimental states are marked by black squares, and the observed path is indicated by the thicker branches. Field of view: 1 nm × 1 nm. (I) A side perspective view of the electron beam tilted with respect to the graphene plane. The sample was kept tilted like this throughout all the frames in (H).