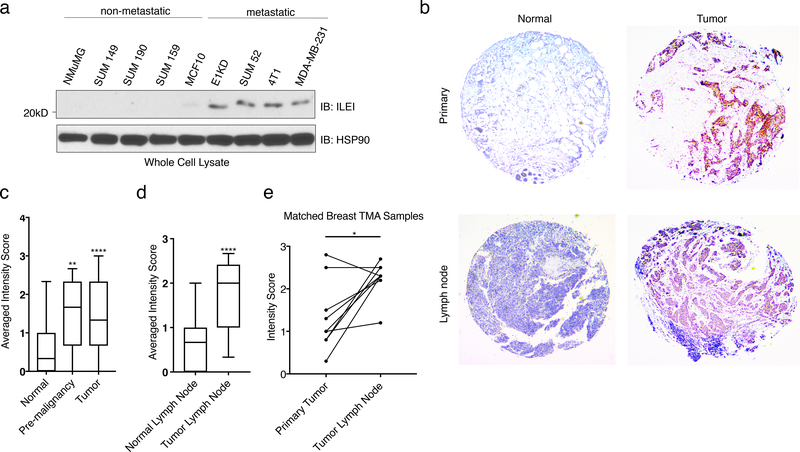
Figure 3. ILEI Protein Levels Correlate with Mammary Tumor Progression.
(a) Immunoblot analysis of basal ILEI levels in both murine and human cell lines that display altered metastatic potential. (b) Representative images taken at 5x magnification of normal breast, tumor breast, normal lymph node or tumor lymph node TMAs after immunohistochemistry analysis of ILEI. (c) Quantification of IHC scores for all normal breast tissue, pre-malignant tissue and tumor tissue samples (box plot represents intensity score distribution minimum to maximum; ****p<0.0001, **p<0.01, unpaired Student’s t-test). (d) Quantification of IHC scores for all normal lymph node tissue, and tumor lymph node tissue samples (box plot represents intensity score distribution minimum to maximum; ****p<0.0001, unpaired Student’s t-test). (e) Plot showing matched primary tumor and lymph node tumor patient samples (n=8, *p=0.013, paired Student’s t-test).

