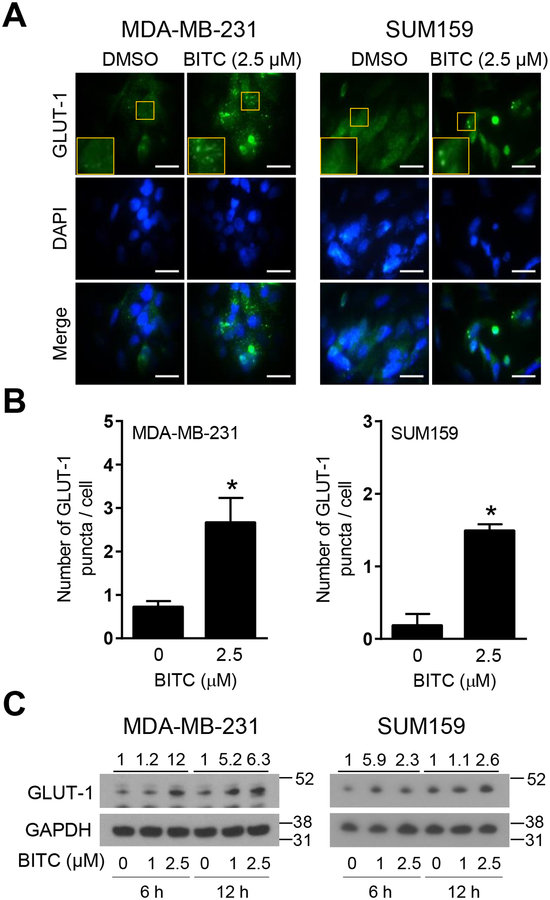
FIGURE 2.
Effect of BITC on translocation of GLUT-1 to the plasma membrane and changes in protein levels in human breast cancer cells. (A) Representative fluorescence microscopy images for GLUT-1 in MDA-MB-231 and SUM159 cells. The cells were treated for 24 h with DMSO (control) and 2.5 μM of BITC. Fluorescence microscopy images were taken at 100 × objective magnification (scale bar = 30 μm). Zoomed images of GLUT-1 puncta are shown in the yellow boxes. The staining for GLUT-1 is shown in green and for nuclei (DAPI) in blue. (B) Quantitation of number of GLUT-1 puncta per cell in MDA-MB-231 and SUM159 cell lines. Experiment was done twice with consistent results and representative data from one such experiment is shown as mean ± SD (n = 3). Statistical significance of differences (*, P < 0.05) was determined by unpaired Student t test. (C) Expression of GLUT-1 protein in MDA-MB-231 and SUM159 cells upon BITC (1 and 2.5 μM) treatment for 6 h and 12 h. Experiment was done at least twice and representative data from one such experiment are shown. Numbers above bands are fold change in expression level of GLUT-1 relative to corresponding DMSO-treated control. Molecular size markers are added to the right side of blots.

