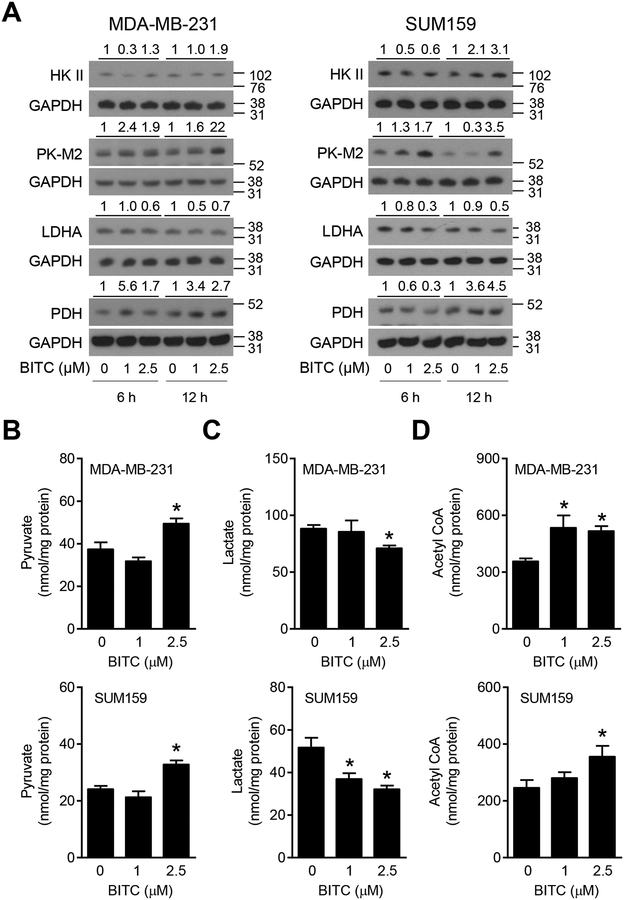
FIGURE 3.
Effect of BITC on glycolysis and TCA cycle proteins. (A) Western blotting for glycolysis and TCA cycle-related proteins in the lysates of DMSO (control)- or BITC (1 and 2.5 μM)-treated MDA-MB-231 and SUM159 cells (6 h and 12 h). Numbers above the blots indicate the fold change in protein level compared to corresponding DMSO-treated control. Molecular size markers are added to the right side of the blots. Experiments were done at least twice and representative blots from one such experiment are shown. Levels of intracellular pyruvate (B), secreted lactate (C), and intracellular acetyl CoA (D) in MDA-MB-231 and SUM159 cells treated for 24 h with DMSO (control) or BITC (1 and 2.5 μM). Experiments were done at least twice and representative data from one such experiment is shown as mean ± SD. Statistical significance of differences (*, P < 0.05) was determined by One-way ANOVA followed by Dunnett’s test.

