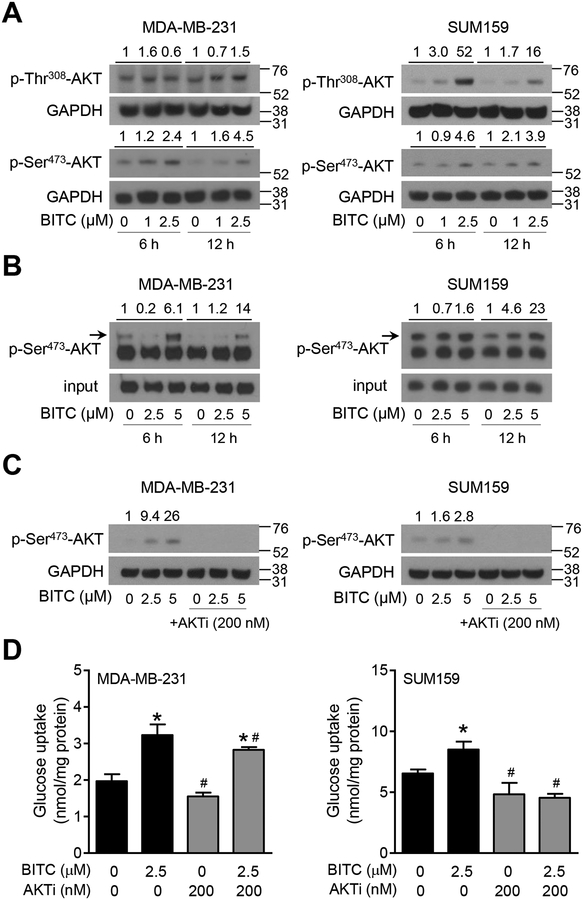
FIGURE 4.
Role of AKT in breast cancer metabolism after BITC treatment. (A) Immunoblotting for phospho-AKT Ser473 and Thr308 in MDA-MB-231 and SUM159 cells upon BITC (1 and 2.5 μM) treatment (6 h and 12 h). Numbers above the blots indicate the fold changes in protein levels compared to corresponding DMSO-treated control and molecular size markers are added to the right side of the blots. (B) AKT kinase activity in MDA-MB-231 and SUM159 cells upon BITC (2.5 and 5 μM) treatment for 6 h and 12 h. Experiments were done at least twice and representative data from one such experiment are shown. Numbers above the blots indicate the fold changes in protein levels compared to corresponding DMSO-treated control. (C) Immunoblotting for p-Ser473-AKT in MDA-MB-231 and SUM159 cells treated with DMSO (control) or BITC (2.5 and 5 μM) with or without AKTi MK-2206 (200 nM) for 24 h. Numbers above the blots indicate the fold changes in protein levels compared to DMSO-treated control. (D) Quantitation of glucose uptake in MDA-MB-231 and SUM159 cells treated with DMSO (control) or BITC (2.5 μM) with or without AKTi MK-2206 (200 nM) for 24 h. Experiments were repeated at least twice (n = 3 for MDA-MB-231 and n = 4 for SUM159). Representative data from one such experiment is shown as mean ± SD. Statistically significant (P < 0.05) compared with the *corresponding DMSO-treated control or #between without AKTi MK-2206 and with AKTi MK-2206 by One-way ANOVA followed by Newman-Keuls multiple comparisons test.

