Fig. 1.
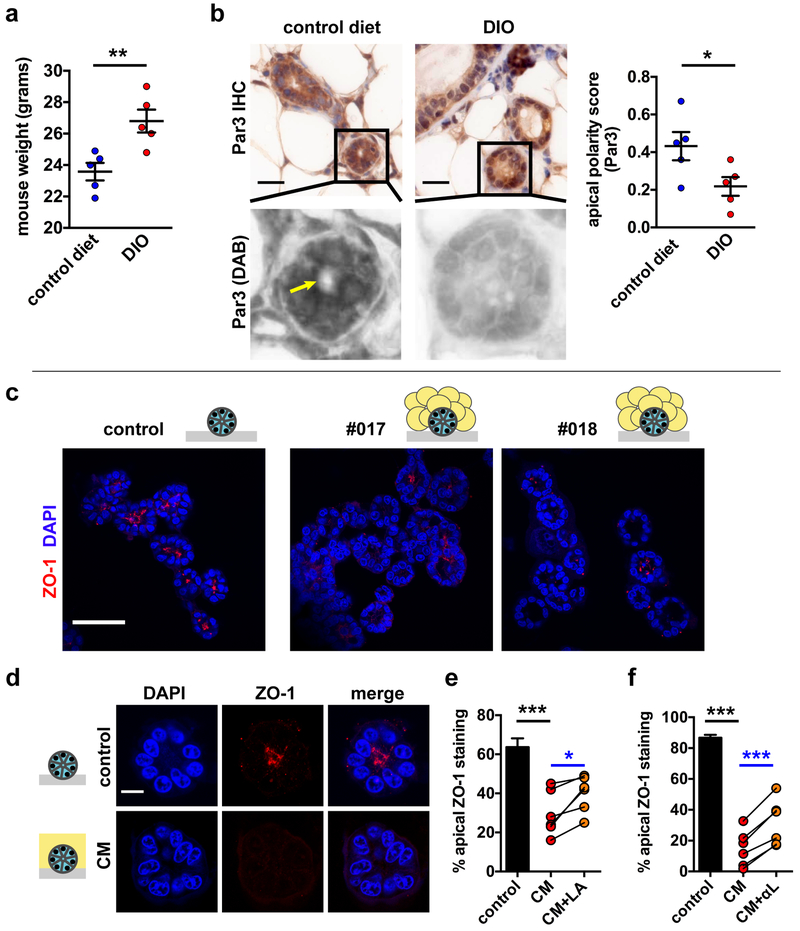
Loss of apical polarity in mouse and 3D cell culture models of obesity. a Weight gain in BALB/c mice fed a high-fat diet (DIO) for 16 weeks compared to littermates fed a control chow diet. **, P < 0.01 (unpaired t-test, n = 5). b Analysis of the Par3 apical marker distribution in whole mount mammary glands from DIO mice and controls. Spectral imaging was used to separate immunohistochemical signals (DAB). The arrow indicates apical Par3 localization. Quantification of Par3 localization is shown in the bar graph. *, P < 0.05 (unpaired t-test, n = 5). c Detection of the tight junction marker ZO-1 by immunostaining and confocal microscopy in HMT-3522 S1 breast acini in 3D cell culture. Differentiated acini were cultured in isolation (control) or cocultured for three days with adipose tissue explants derived from reduction mammoplasties (patients #017 and #018). Nuclei were counterstained with DAPI. d ZO-1 distribution in S1 acini treated for 3 days with medium conditioned by human mammary adipose (CM). e-f Quantification of ZO-1 localization in untreated acini (control) and in acini treated with CM, in the absence or presence of a LEPR antagonist (LA; 1 µg/ml) (e) or leptin neutralizing antibodies (αL) (f). CM was generated with adipose tissue from different patients, each represented by a dot on the graphs. *, P < 0.05 and ***, P < 0.001 (unpaired t-test [black] or paired t-test [blue]; n = 6). Means ± SEM are shown in the graphs. Scale bars, 20 µm (b), 50 µm (c), and 10 µm (d).

