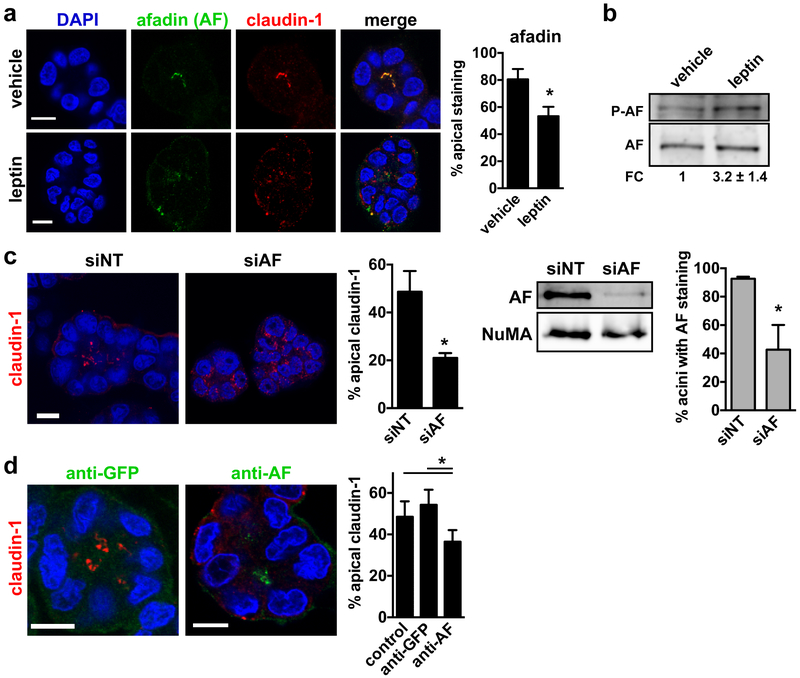
Fig. 4.
Leptin leads to mislocalization of the Akt substrate afadin. a Immunostaining for afadin (AF) and claudin-1 in differentiated S1 acini treated for 72h with vehicle or leptin (100 ng/ml). The proportion of acini with apical AF is shown on the graph. *, P < 0.05 (unpaired t-test; n = 3). b Western blot analysis of total and phosphorylated AF (S1718) in S1 cells treated with vehicle or leptin. Fold change (FC) was calculated by densitometry (n = 3). c Quantification of apical claudin-1 localization in acini derived from S1 cells transfected with nontargeting (NT) or AF-specific siRNA. *, P < 0.05 (unpaired t-test; n = 3). AF silencing was verified by western blot in 2D S1 cultures used for seeding 3D acini cultures. NuMA is shown as loading control. AF silencing was also verified by immunostaining in S1 acini. The proportion of acini with detectable AF signals is shown on the right. *, P < 0.05; (unpaired t-test; n = 3). d Introduction of AF antibodies in live S1 acini. Acini were fixed after 2h incubation with anti-AF or anti-GFP (used as control). Claudin-1 was localized by immunofluorescence. Afadin and GFP antibodies were visualized using secondary fluorescent antibodies. The proportion of acini with apical claudin-1 are shown. *, P < 0.05 (one-way ANOVA and Tukey's, n = 4). Mean ± SEM are shown in the graphs. Scale bars, 10 µm.

