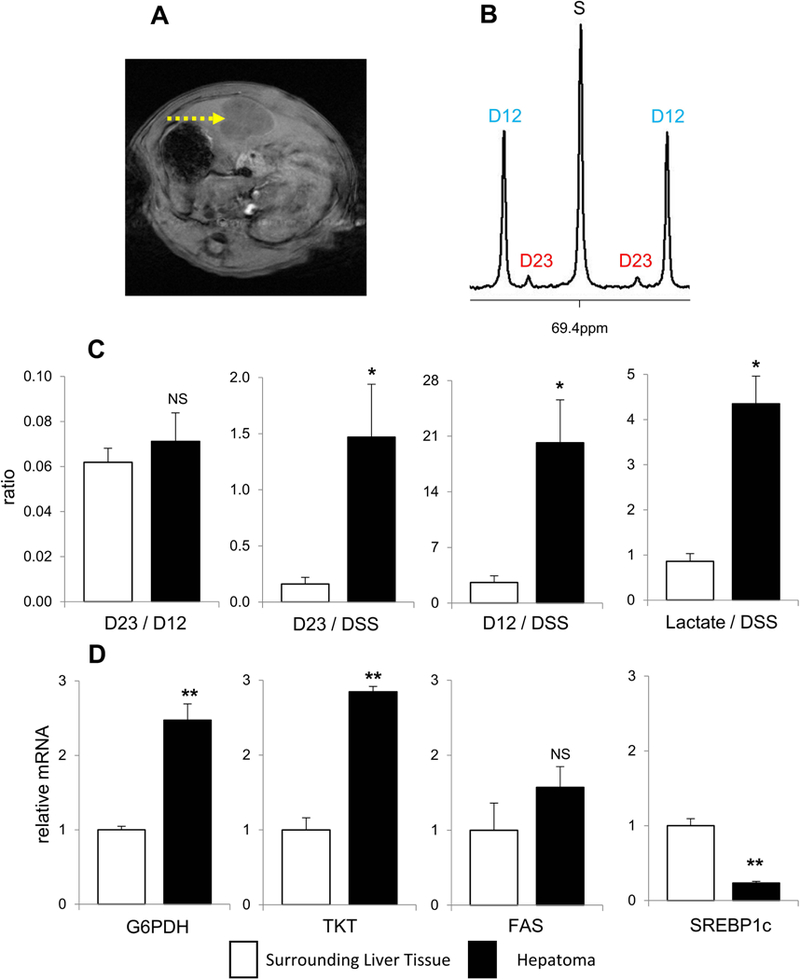
Figure 4. PPP activity in hepatoma.

(A) T1-weighted MRI shows hepatoma (arrow) of a rat on the 14th day after the inoculation of tumor cells. (B) 13C NMR of lactate C2 from hepatoma shows the signal from [2,3-13C2]lactate (D23) produced through the PPP and the signal from [1,2-13C2]lactate (D12) through glycolysis. (C) The ratio of D23/D12 (PPP/glycolysis) is the same between hepatomas and surrounding liver tissues. However, the level of D23 (PPP activity), the level of D12 (glycolysis), and the concentration of lactate all are higher in hepatomas compared to surrounding liver tissues. (D) The mRNA expressions of G6PDH and TKT are higher, but the expression of SREBP1c is lower in hepatomas compared to surrounding liver tissue. The expression of FAS is not altered in hepatomas. Data are means ± SEM (n=3); ∗, p<0.05; ∗∗, p<0.001.
