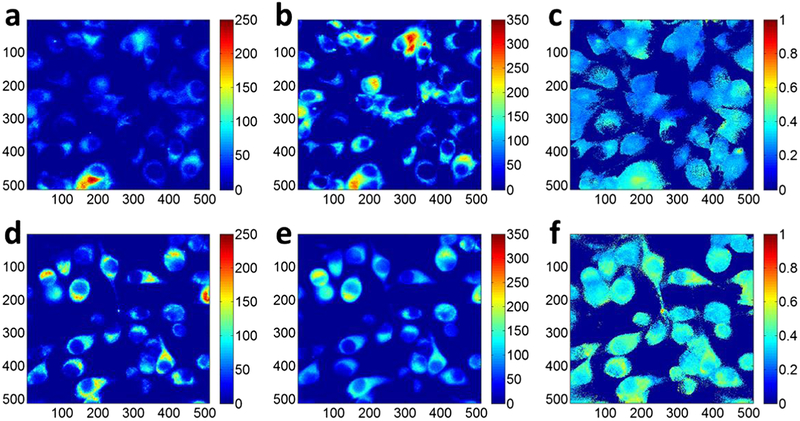
Fig. 2.
Typical redox images of the control (0.8 % DMSO): a Fp, b NADH, and c Fp/(NADH+Fp) and the treated (150 μM LND): d Fp, e NADH, and f Fp/(NADH+Fp). The image matrices were 512 × 512 (pixel size: 0.32 × 0.32 × 0.2 μm3 and binning: 2 × 2). The color bars of the Fp and NADH images indicate the signal intensity in arbitrary unit. The color bar of the Fp redox ratio image indicates the ratio range from 0 to 1.

