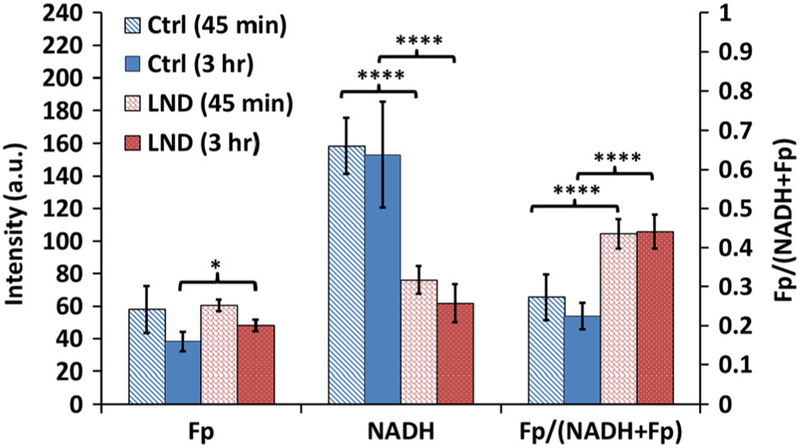
Fig. 3.
Lonidamine treatment effects on the ORI redox indices (mean ± SD) of DB-1 melanoma cells in culture. Two treatment time windows: 45 min and 3 h for either lonidamine (LND, 150 μM) or control (Ctrl, 0.8% DMSO). One-way ANOVA with Bonferroni correction was used to compare the redox indices between LND and Ctrl for each window. *p < 0.05, ****p < 0.0001.

