Fig. 5.
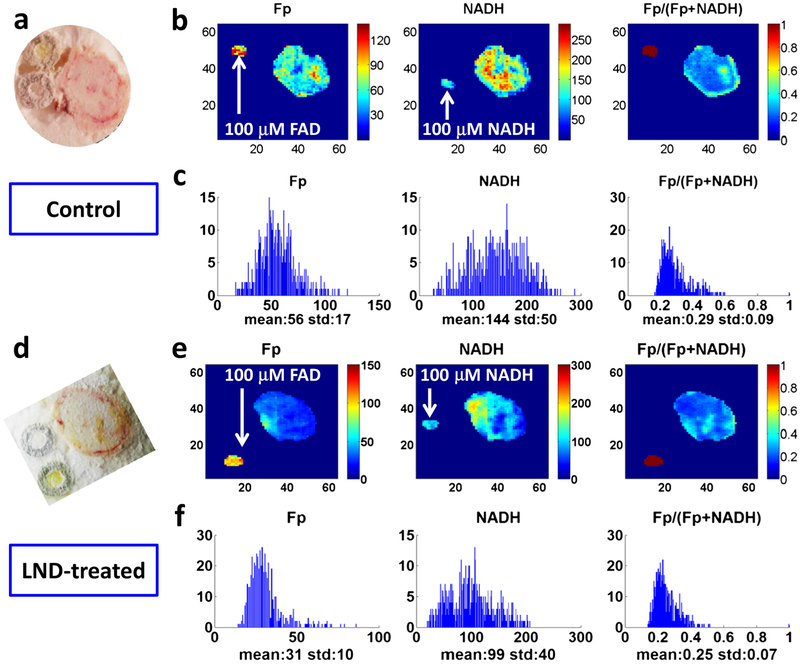
Redox images and their corresponding histograms of typical sections in DB-1 melanoma xenografts. a–c A section of a control DB-1 tumor at 1100 μm depth. a White light photo and b images of Fp, NADH, and Fp/(Fp+NADH) corresponding to the section. The image matrices were 64 × 64, and the step size was 200 μm. The color bars of the Fp and NADH images indicate the nominal concentrations in micromolar referenced to the corresponding snap-frozen solution standards. The color bar of the Fp redox ratio image indicates the ratio range from 0 to 1. c The x-axes of the histograms represent the nominal concentration of Fp or NADH or the Fp redox ratio in that section. The y-axes of the histograms represent the number of pixels having a specific value of Fp or NADH or the Fp redox ratio. d–f A section of a LND-treated DB-1 tumor at 1200 μm depth. d–f as described for a–c.

