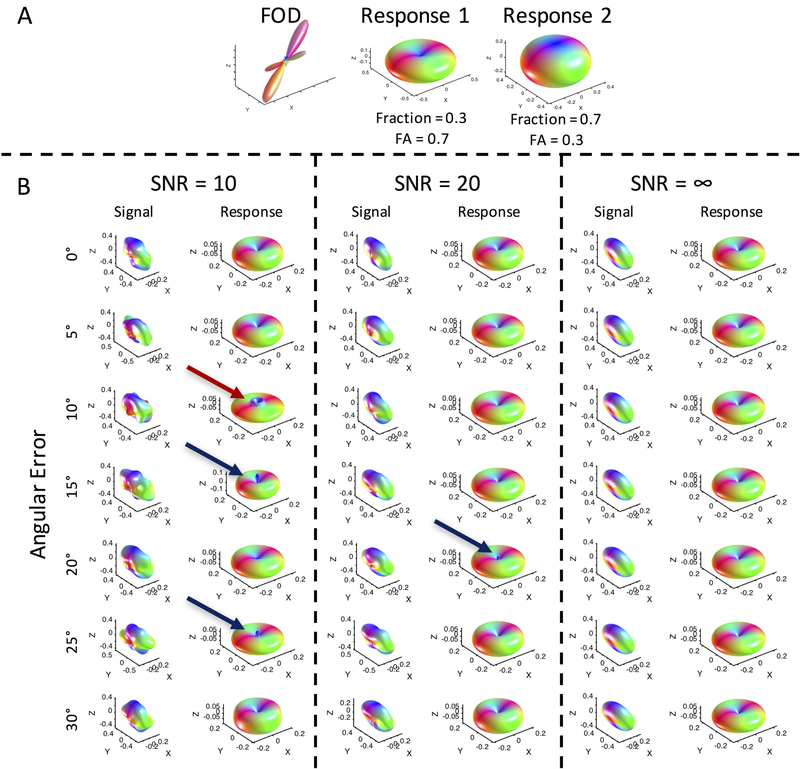
Figure 11.
Noise and misalignment can cause errors in estimating the response functions in crossing fiber regions. FODs and signal at varying noise levels (SNR = ∞, 10, and 20) and misalignments (angular errors of 0–30 degrees) were used to derive response functions. Noise can cause spurious peaks axially (blue arrows), and can result in “cusp-like” shapes near the poles.

